Cutline Test Images
Exporting an GeoTiff-Image from a Raster Coverage
<-- 'Index Page for RasterLite2 - Commands'
For the cutline logic, the following 2 images are being used for testing
- the result of is shown here --> 'Cutline-Images'
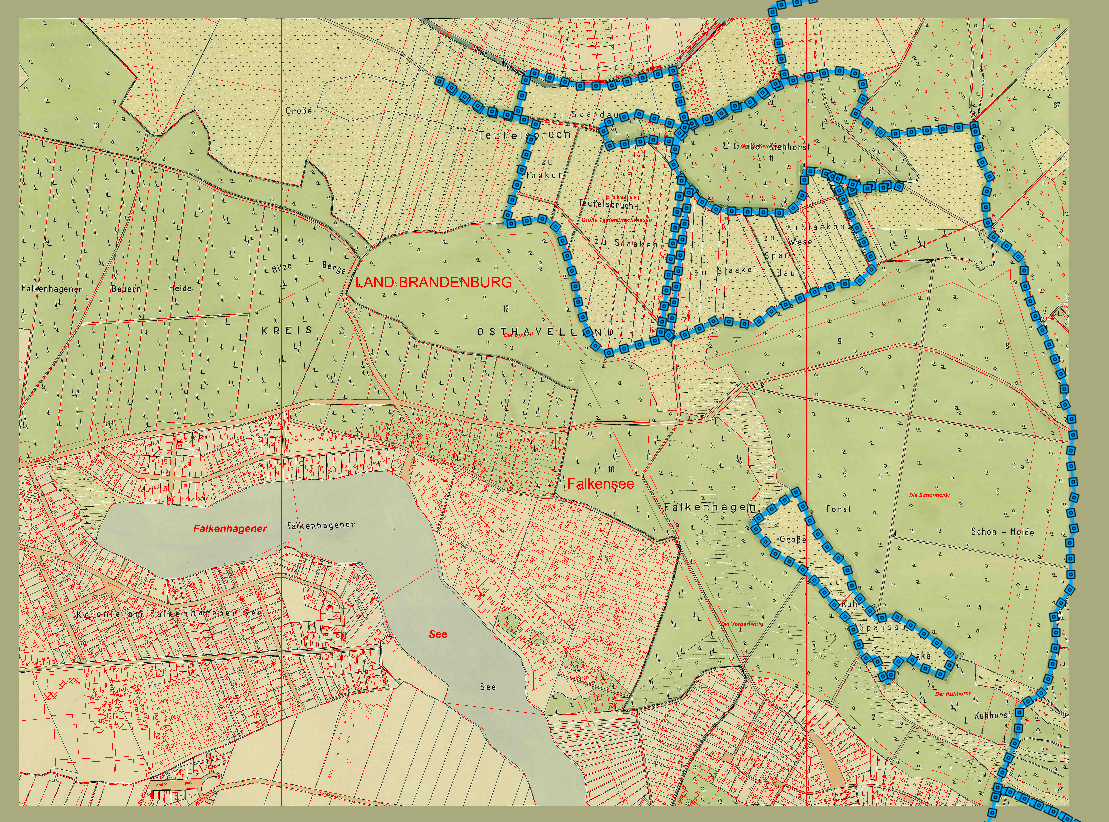
1927 Area of Eiskeller, Berlin-Spandau, Falkensee, Brandenburg
- these are 2 maps of the 1:4000 series (4366 and **4365)
- taken together, both maps correspond to today's 1:5000 map (436B)
- the original images was downloaded from the WMS-Server of
- These images were then (re) georeferenced with a 2010 version the 436B map
- in the QGIS image below, shown as the red lines
- The geometry is based on the property found on the 2010 version the 436B map
- the city district of Spandau around 1928
- which is a MULTIPOLYGON
- one POLYGON being the main district (Upper/Right hand area)
- with 5 interior rings (enclaves)
- 3 of which can be seen here
- with 5 interior rings (enclaves)
- 6 POLYGON's being exclaves
- one of which can be seen here (Lower/Right)
- one POLYGON being the main district (Upper/Right hand area)
- which is a MULTIPOLYGON
- the city district of Spandau around 1928
The goal of the 'Cutline option' will be to show:
- main POLYGON portion
- with the 3 enclaves being transparent
- the second POLYGON
- which will be surrounded as a transparent area
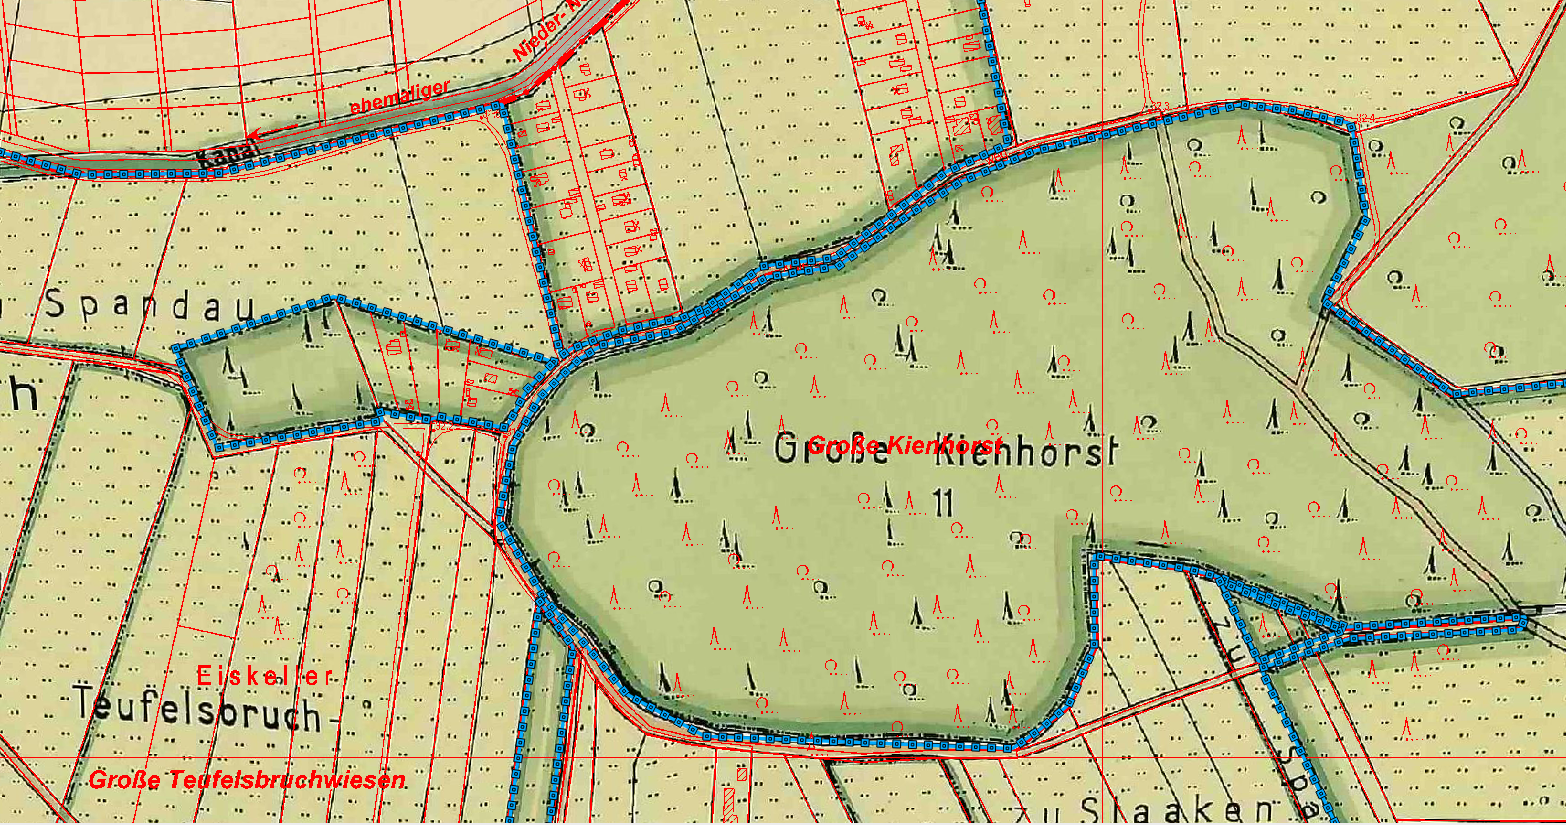
1927 Area of Teufelsbruch, Eiskeller, Berlin-Spandau
- shows the area to be ['cutout'] (Cutline-Images#teufelsbruch):
- main POLYGON portion
- which is only connected by a slim path
- the 3 enclaves
- with only the northern portion of the third being shown
- main POLYGON portion
When the Cutline option is used
- looks like this --> 'Cutline-Images'
2015-10-13: Mark Johnson, Berlin Germany