-
Notifications
You must be signed in to change notification settings - Fork 7
‒m timestat
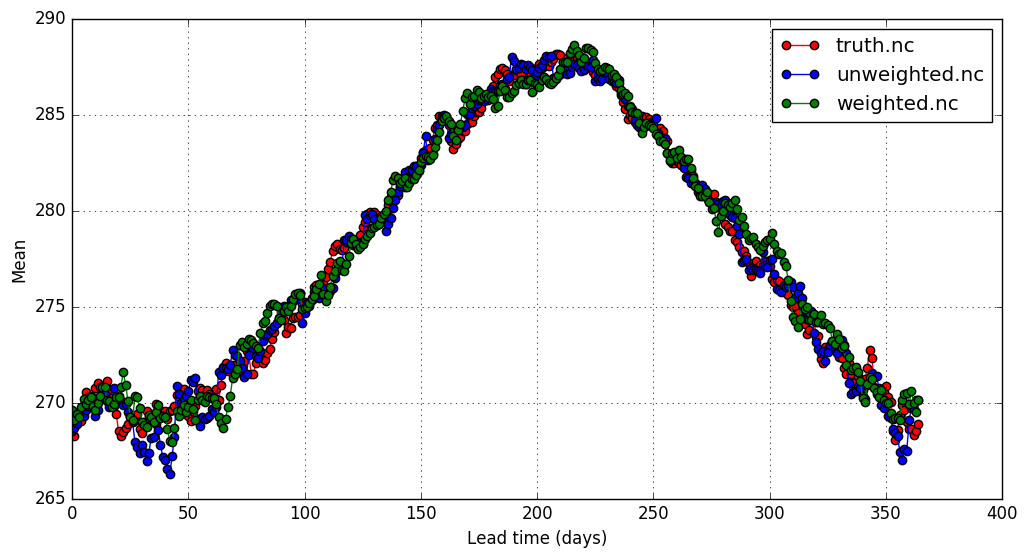
This shows ensemble statistics for each leadtime. By default, the plot shows the ensemble mean:
wxgen verif truth.nc unweighted.nc weighted.nc -v 0 -m timestat
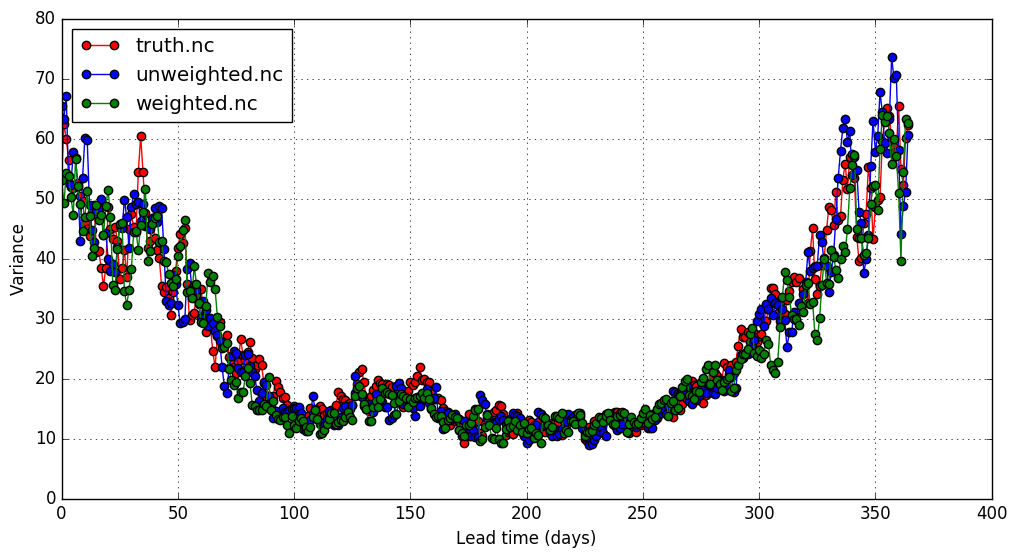
By default, -m timestat shows the mean across the ensemble. Use -a to specify a different aggregator, such as median, std, variance, range, iqr, and a few others:
wxgen verif truth.nc unweighted.nc weighted.nc -v 0 -m timestat -a variance
To show the fraction of members indicating a summer day (daily average temperatur above 10°C [this will be changed in the future]):
wxgen verif truth.nc unweighted.nc weighted.nc -v 0 -m timestat -tr summerday
Wxgen first transforms the variable into a 0 or 1 value, and then averages these values (since the default aggregator is the mean). The value can therefore be interpreted as the fraction of days that are summer days.
-tr can be combined with -a. That is -tr summerday -a median will give the median value of the summerday binary values, which will therefore always be 0 or 1 (so perhaps not as useful).
Since the scenarios are sampled by joining 10 day segments together, it is useful to see the statistics for each of the leadtimes from the originating database. This can be achived by transforming the timescale using a modulus.
-tm 9 can be used when the database has 10 days.
wxgen verif sim1.nc sim2.nc -v 0 -m timestat -tm 9Copyright © 2016-2019 Norwegian Meteorological Institute
- Home
- Creating scenarios
- Creating truth scenarios
- Verification
- Other
- Developing
- Change log