‒m covarmap
This shows the anomaly correlation between every point in the domain and a specified lat/lon position. The position is specified using -lat and -lon.
wxgen verif sim1.nc sim2.nc -v 0 -m covarmap -lat 60 -lon 10 -clim 0.8,1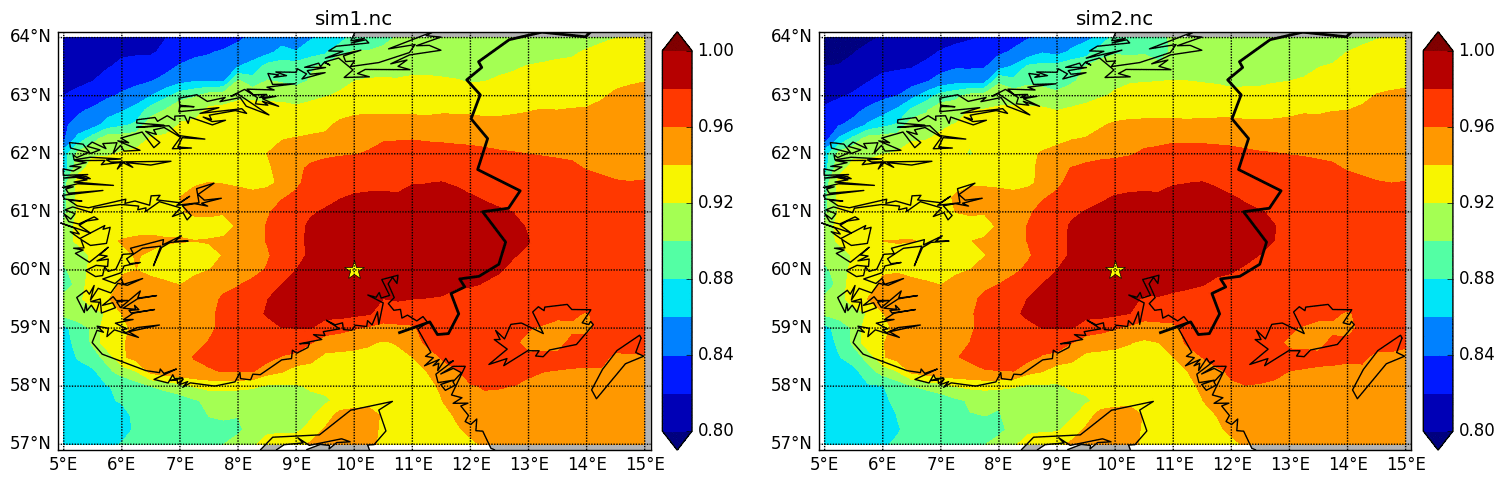
The [-clim] option define the colorbar limits (lower, upper)