This is a container which is helpful for all kinds of (Production) Debugging work. It is heavily inspired by nicolaka/netshoot, but additionally contains the eBPF tools (BCC and bpftrace). It is also Ubuntu based and not Alpine based, because some tools (namely traceloop) only work with glibc.
This image supports tracing in Docker-for-Mac and in Linux workloads.
This readme has been heavily copied from Netshoot. THANK YOU SO MUCH for your work!
The Docker Image is published on docker-hub.sandstorm.de/public-containers/ebpf-tracer:latest and is Publicly Available without any authentication.
docker run --rm --privileged -it -v /lib/modules:/lib/modules:ro -v /etc/localtime:/etc/localtime:ro -v /var/run/docker.sock:/var/run/docker.sock --pid=host --env SHELL_ENV_DISPLAY=dev-local docker-hub.sandstorm.de/public-containers/ebpf-tracer:latestFor Linux environments, you should additionally mount the kernel headers from /usr/src.
docker run --rm --privileged -it -v /lib/modules:/lib/modules:ro -v /usr/src:/usr/src:ro -v /etc/localtime:/etc/localtime:ro -v /var/run/docker.sock:/var/run/docker.sock --pid=host --env SHELL_ENV_DISPLAY=dev-local docker-hub.sandstorm.de/public-containers/ebpf-tracer:latestdocker run --rm -it php:7
# inside php container
while(true) { file_get_contents("https://sandstorm.de"); echo "."; sleep(2); }# inside debugging container
ps faux | grep -i php # find pid of php
strace -p <PID> # trace all syscalls of php
cd /bpf
bpftrace socket-timings.bt 3403 3403 # stop recording with Ctrl+C to see resultsUse the following manifest as example:
# debugger.yml
apiVersion: v1
kind: Pod
metadata:
  name: debugger
  # namespace: test-perfdebugging # set as needed
spec:
  # nodeName: .... # you should pin the workload to the node you want to debug.
  hostPID: true
  restartPolicy: Never
  containers:
    - name: debugger
      image: docker-hub.sandstorm.de/public-containers/ebpf-tracer:latest
      imagePullPolicy: Always
      securityContext:
        privileged: true
      env:
        - name: SHELL_ENV_DISPLAY
          value: production system # configures the colorful warning in the bash, see bash.colorprompt.sh
Now, wait until the container is up and running fully: kubectl get pods -w.
Now, you can connect: kubectl exec -it debugger. If you use sku, you
can run sku enter. Happy debugging!
The following is printed when the container starts up:
_ _
| | | |
__| | ___| |__ _ _ __ _
/ _` |/ _ \ '_ \| | | |/ _` |
| (_| | __/ |_) | |_| | (_| |
\__,_|\___|_.__/ \__,_|\__, |
__/ |
|___/
This is a Debug Container inspired by github.com/nicolaka/netshoot.
---------------------------------------------
TOOL OVERVIEW
This includes following tools on PATH:
- Linux Performance Tools: http://www.brendangregg.com/Perf/linux_observability_tools.png
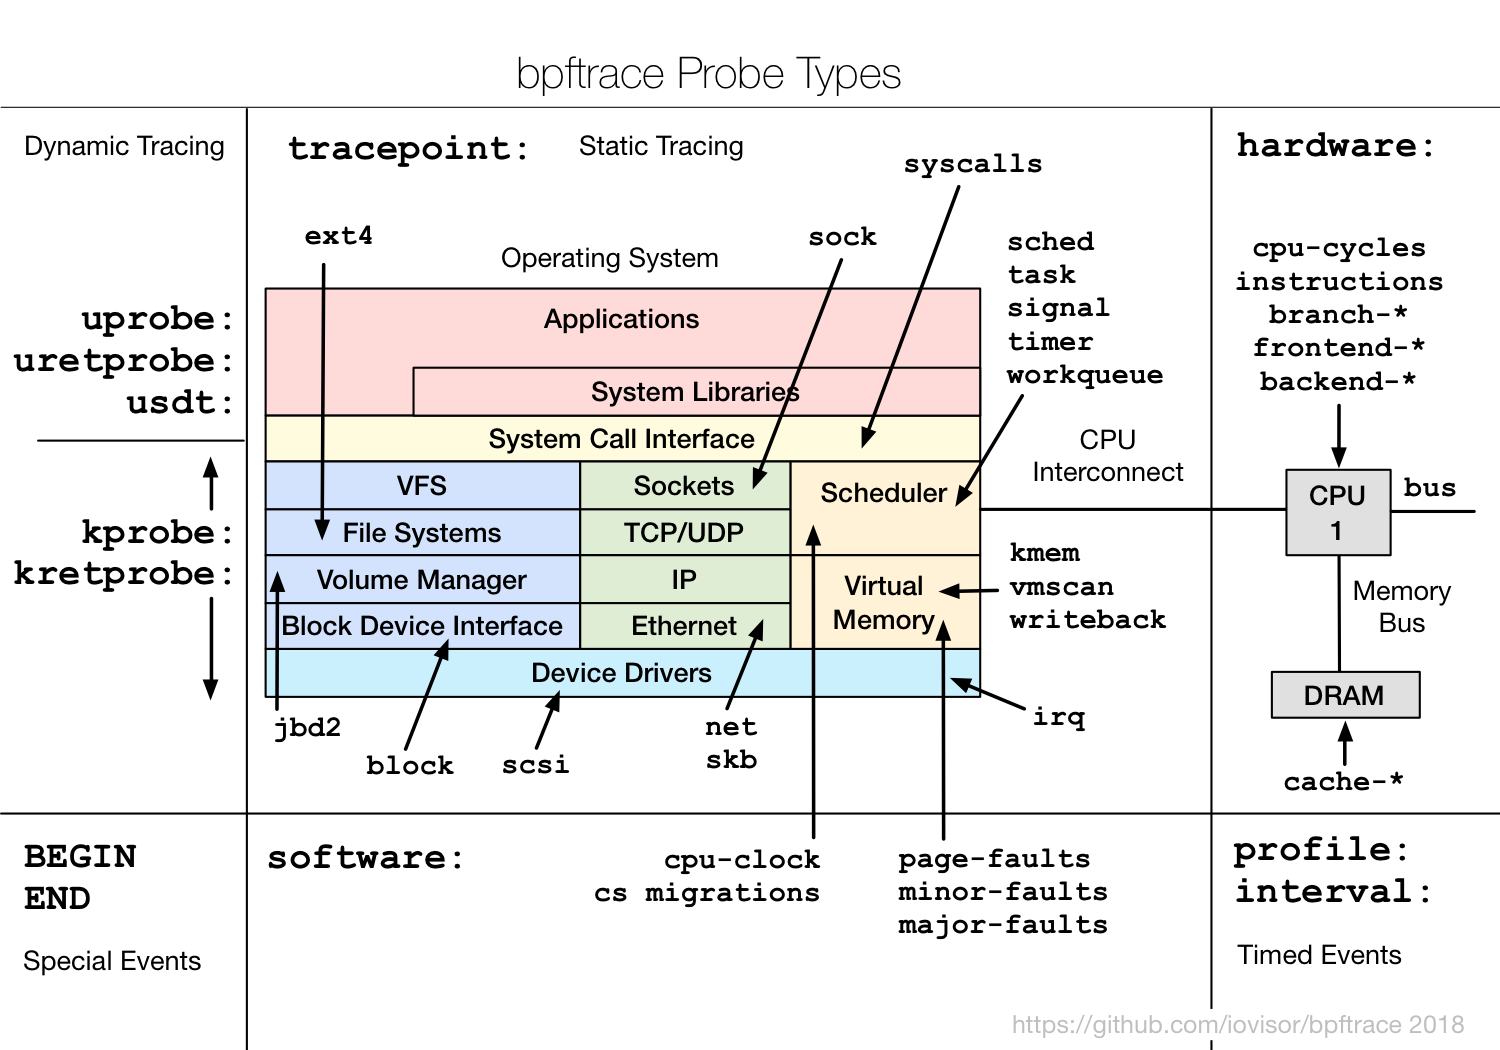
- eBPF bpftrace tools: https://raw.githubusercontent.com/iovisor/bpftrace/master/images/bpftrace_probes_2018.png
Usage Examples: https://github.com/iovisor/bpftrace/blob/master/README.md#tools
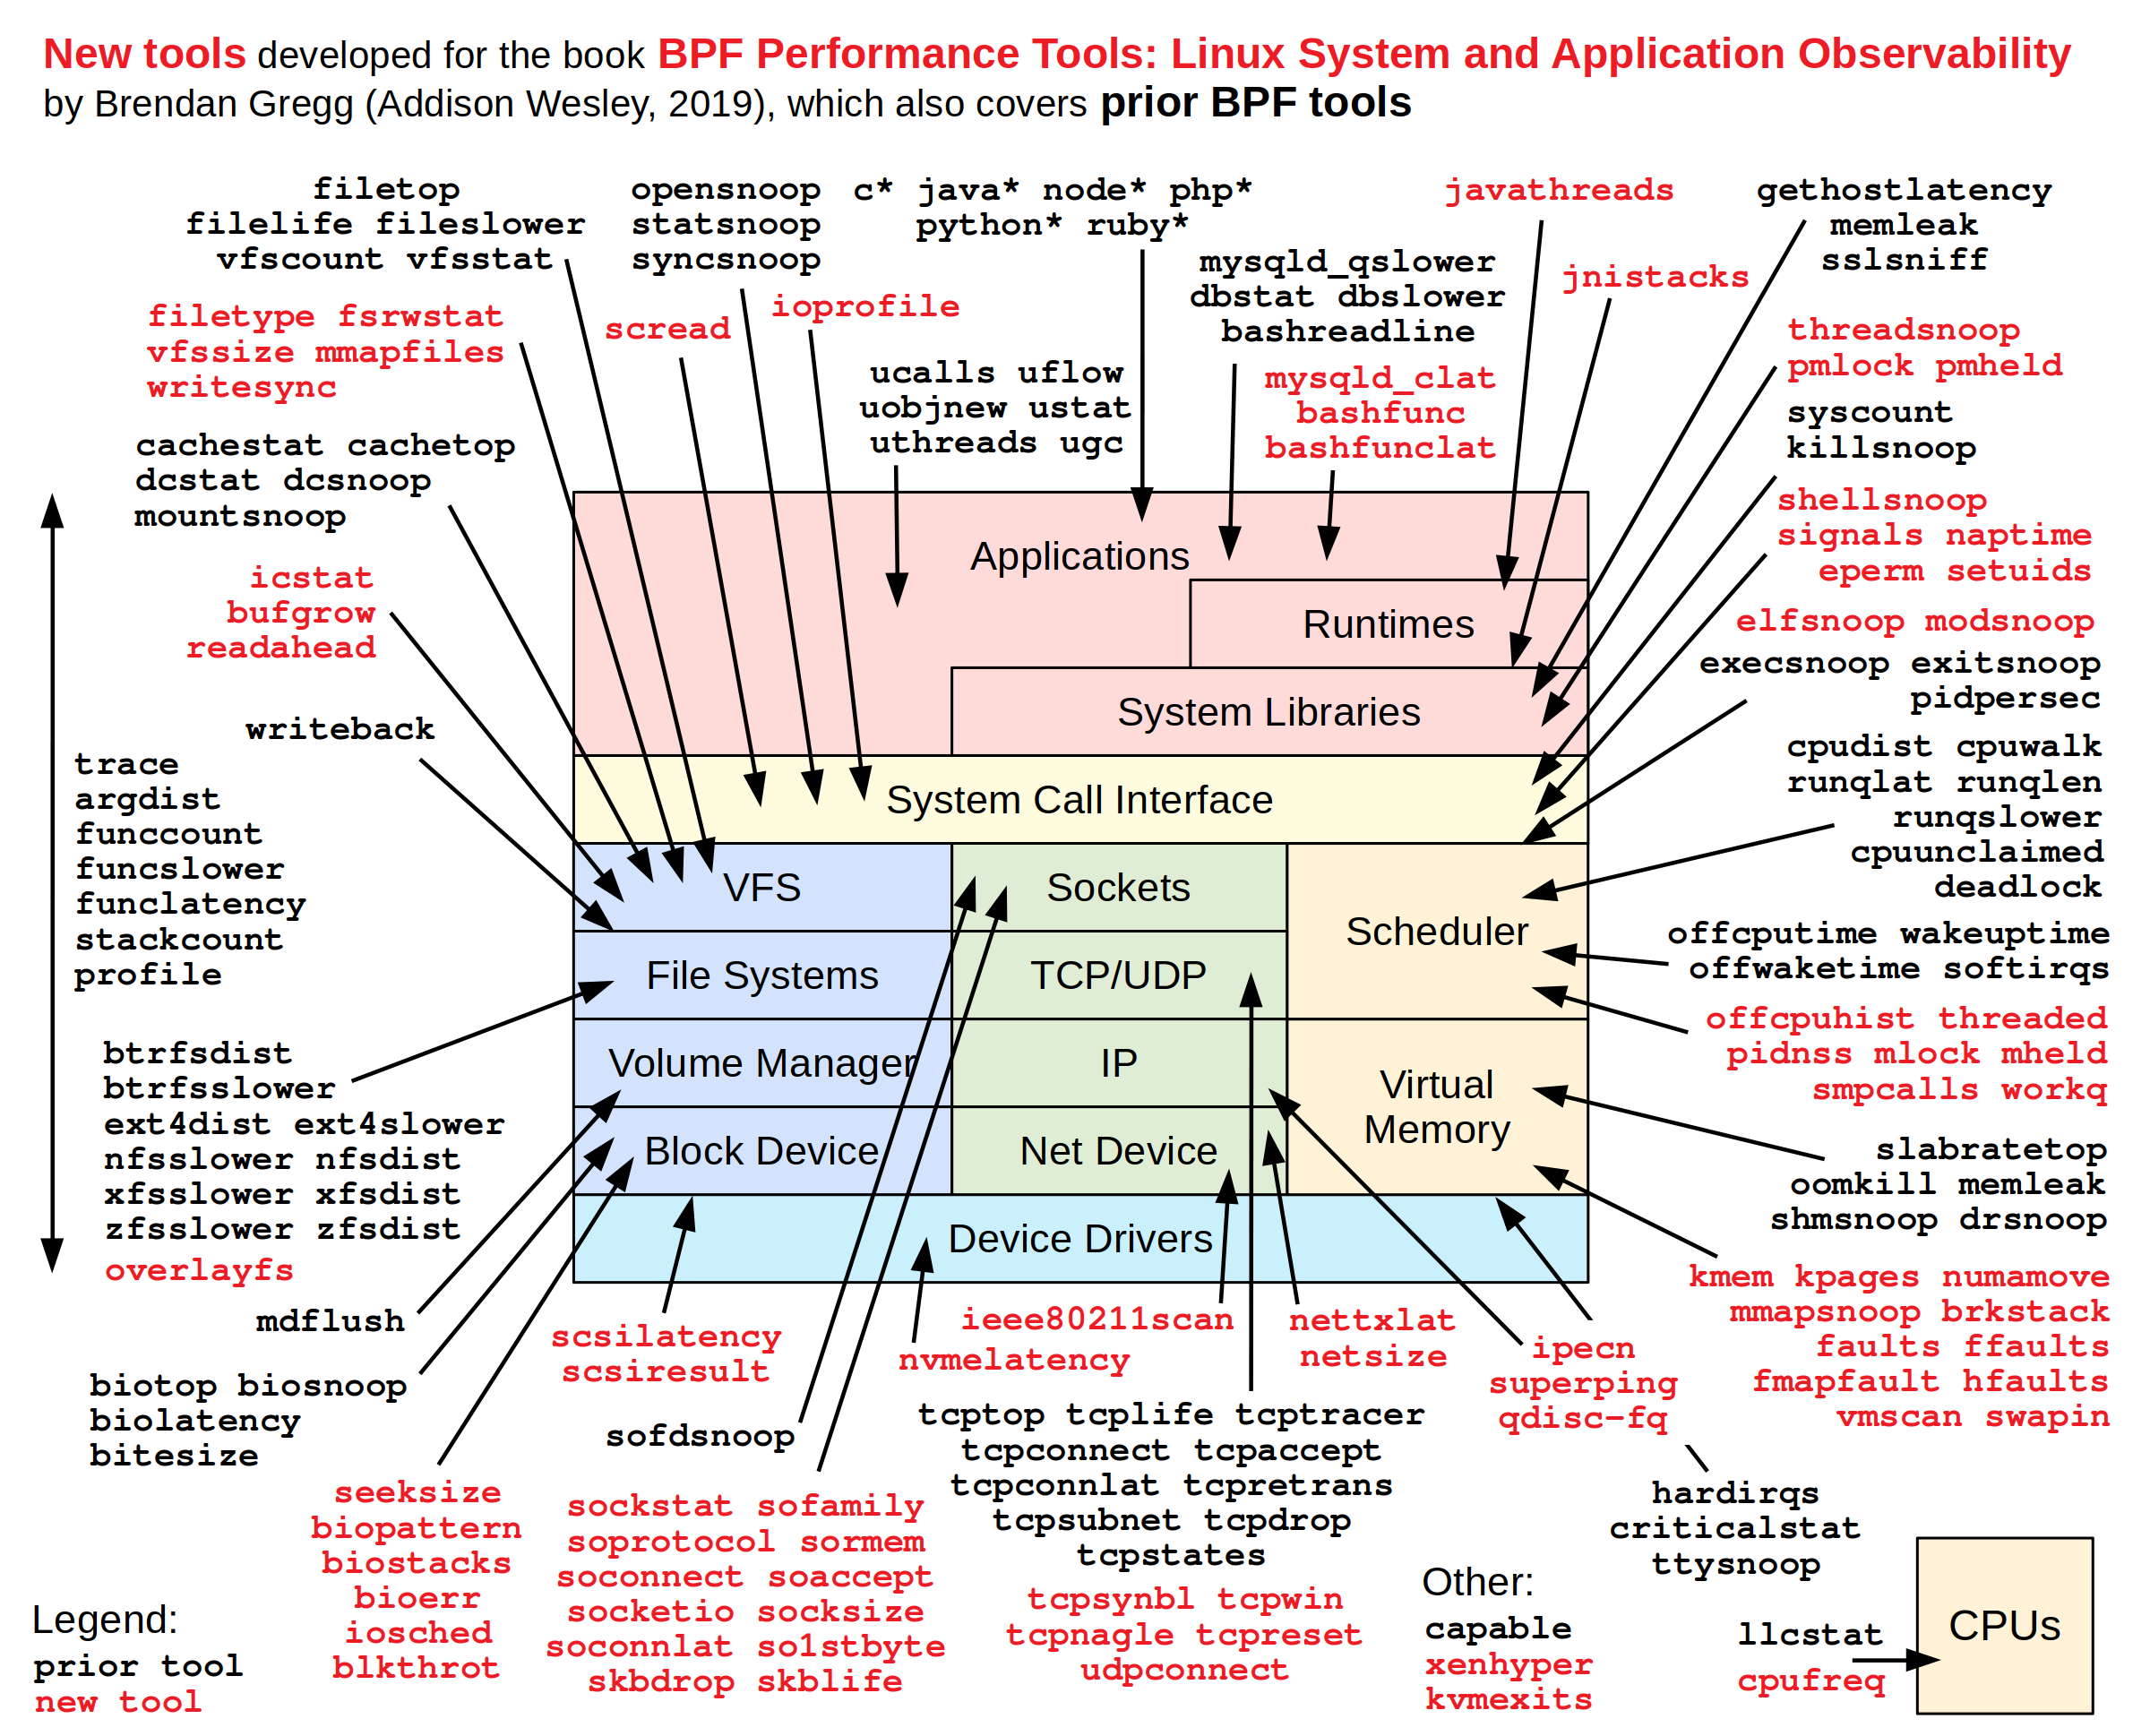
- eBPF BCC tools: http://www.brendangregg.com/BPF/bpf_performance_tools_book.png
Usage Examples: https://github.com/iovisor/bcc#contents
MORE tools: https://github.com/brendangregg/bpf-perf-tools-book
- https://github.com/brendangregg/bpf-perf-tools-book/blob/master/originals/Ch10_Networking/soconnect.bt
+ some more (traceloop, jq, vim, calicoctl, websocat, docker CLI, tmux, screen)
---------------------------------------------
USAGE
- needs privileged mode (docker: --privileged; k8s: securityContext.privileged=true)
- needs Host PID namespace (docker: --pid=host; k8s: hostPID=true)
For eBPF tools, the following is needed:
- mount -t debugfs debugfs /sys/kernel/debug
- /usr/src/ must contain the kernel sources
- /lib/modules/ must be mounted from the host
You can run /prepare-bpf.sh which automates the above three steps.
If the directories are not mounted, they are copied from the host (via /proc/1/root).
By default, the kernel sources for a recent Docker for Mac
version are included in the image.
---------------------------------------------
FIRST STEPS
ps faux # process listing
bpftrace -l # list BPF probes
bpftrace -lv tracepoint:syscalls:sys_enter_connect
# get args of tracepoint
ls /proc/1/root/ # contains the HOST file system !!! WATCH OUT !!!
ls /bpf/ # our custom bpftrace scripts
tmux -CC # for opening a multiplexed console (iTerm on OSX only). ESC to send to BD
tmux -CC attach # for reconnecting to the BG shell (iTerm on OSX only)
screen # alternative to tmux
---------------------------------------------

The list of tools with usage examples can be found in the BPFTrace README.
docker build --progress=plain --pull -t ebpf-debug .
docker run --rm --privileged -it -v /lib/modules:/lib/modules:ro -v /etc/localtime:/etc/localtime:ro -v /var/run/docker.sock:/var/run/docker.sock: --pid=host --env SHELL_ENV_DISPLAY=dev-local ebpf-debug- This is based on https://petermalmgren.com/docker-mac-bpf-perf/ and more specifically https://github.com/singe/ebpf-docker-for-mac