-
Notifications
You must be signed in to change notification settings - Fork 24
Server status setup
Nyo edited this page Apr 10, 2016
·
1 revision
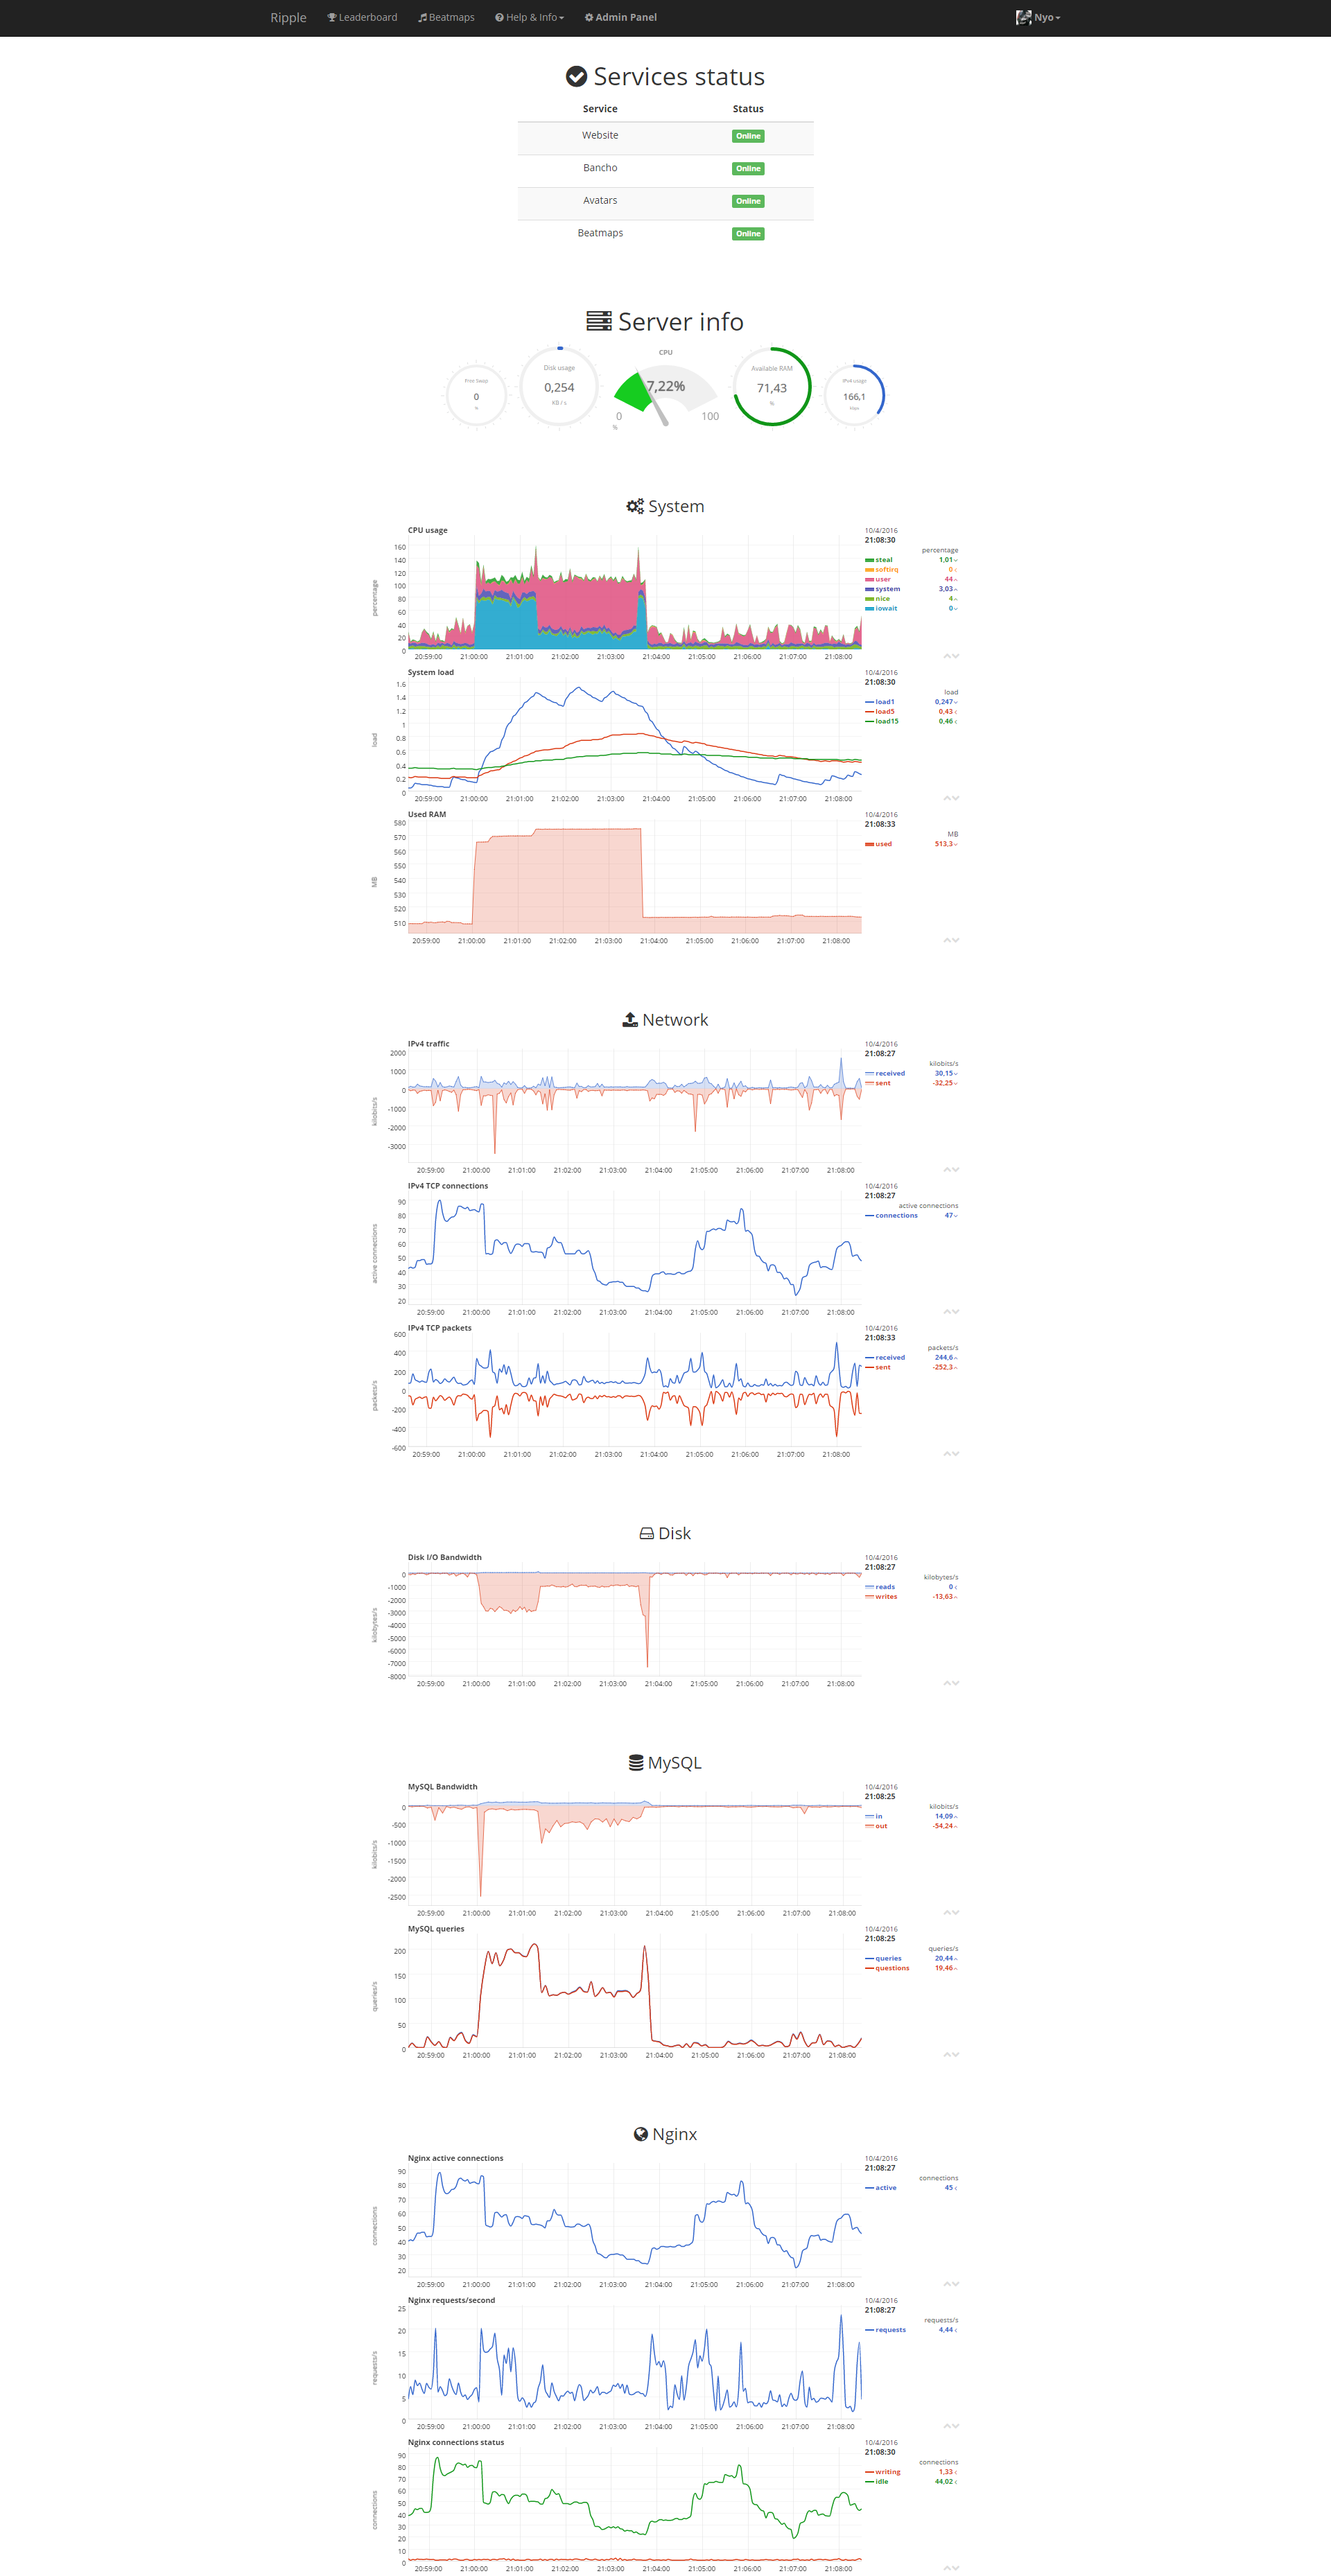
If you want a fancy server status page that shows services status and cpu, memory, ipv4 usage and more (like this one), follow this guide.
- Netdata (for server info graphs)
If you want to show the fancy server info graphs on your server status page, you need Netdata. Install it by following the instructions on Netdata's github page.
You don't need to change any particular setting to make netdata work with ripple, but if you want to show mysql and nginx graphs, you'll need to configure mysql.chart.sh and nginx.chart.sh netdata plugins. Google how to do that, if you want them.
Open your ripple config.php file (path/to/ripple/osu.ppy.sh/inc/config.php) and configure the $ServerStatusConfig array.
-
service_status
-
enable- If true, system status page will show services status -
bancho_url- pep.py URL.http://127.0.0.1:banchoportshould work fine. -
avatars_url- avatar server URL.http://127.0.0.1:avatarserverportshould work fine. -
beatmap_url- beatmap mirror URL. Keep it athttp://bcache.zxq.co/unless you are using a non default mirror.
-
-
netdata
-
enable- If true, system status page will show the fancy graphs -
server_url- Your netdata server URL. Make sure its protocol is https if you are running ripple under https. -
header_enable-true/false. Show header with main server stats -
system_enable-true/false. Show cpu/load/ram graphs -
network_enable-true/false. Show IPv4 graphs -
disk_enable-true/false. Show disk graphs -
disk_name- Your disk name. -
mysql_server- MySQL server name inside netstat's config file -
mysql_enable-true/false. Show mysql graphs. You must have configured netstat's mysql plugin. -
nginx_enable-true/false. Show nginx graphs. You must have configured netstat's nginx plugin.
-