Once you import the Grafana Dashboards on your Environment, it should look all like these:
VMware vSphere Overview Dashboard

VMware vSphere Hosts Dashboard

VMware vSphere Datastores Dashboard

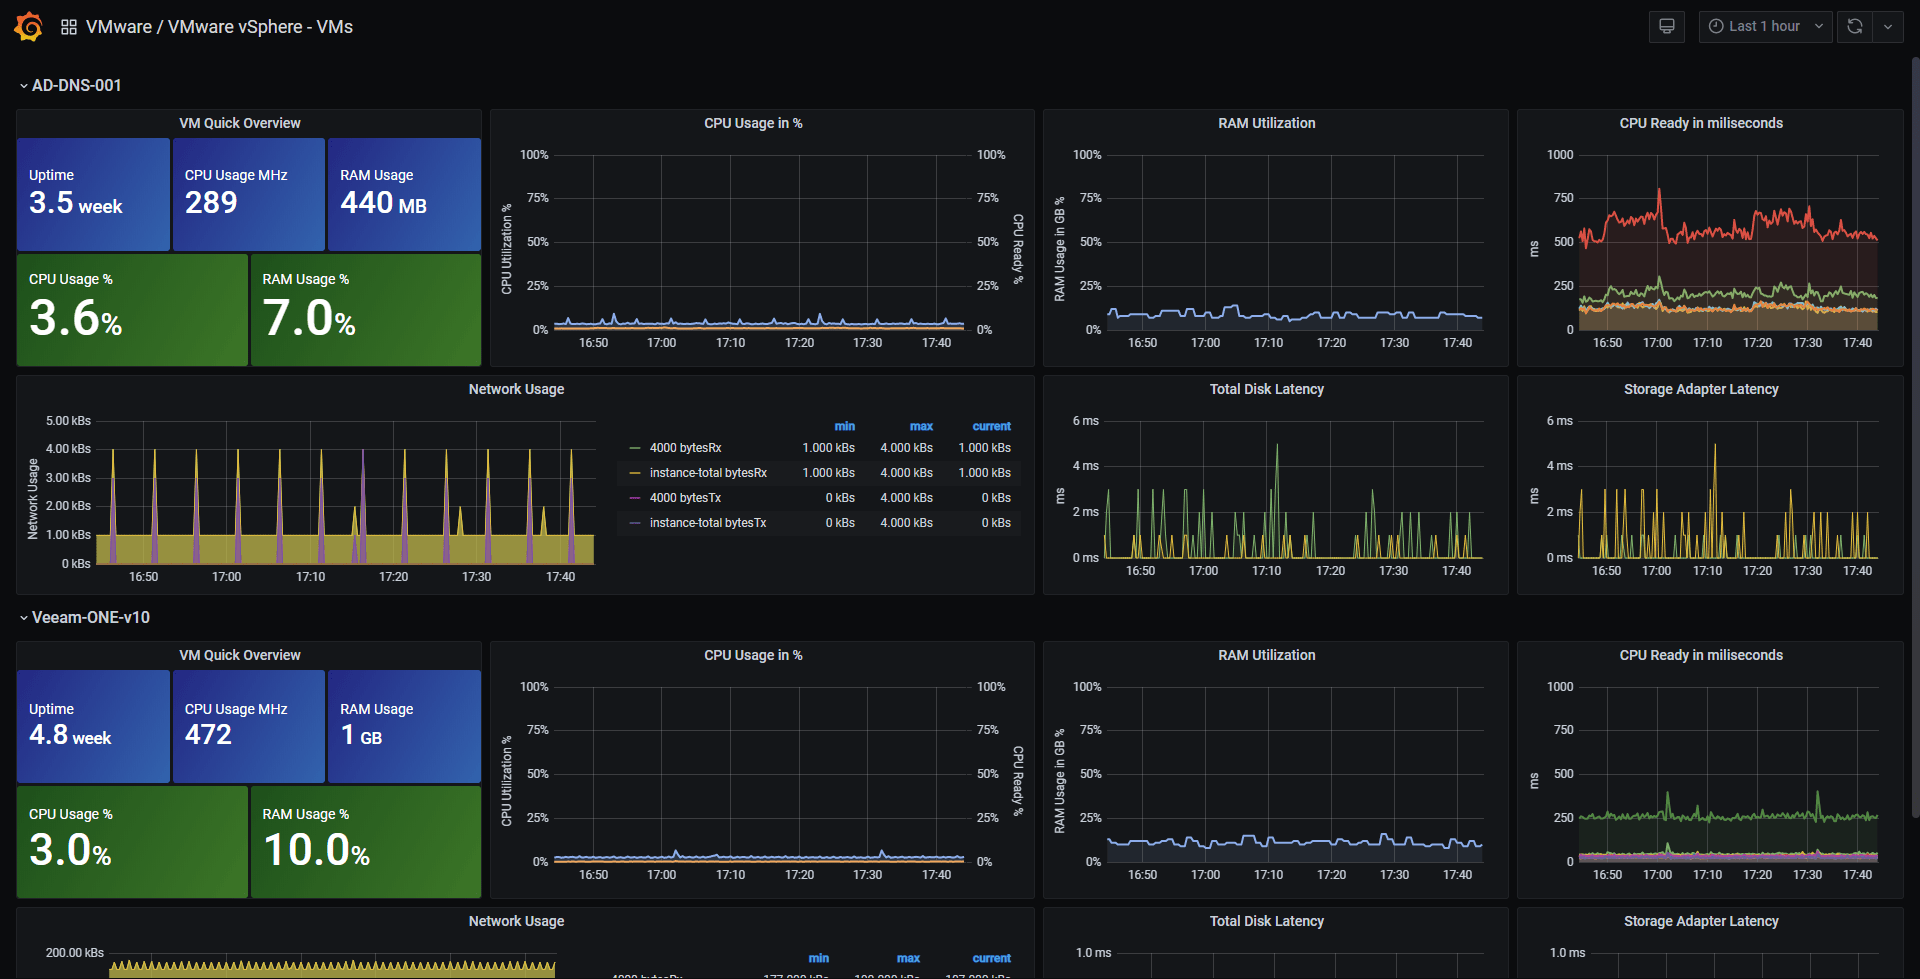
VMware vSphere VMs Dashboard
You can follow the steps on the next Blog Post in English - https://jorgedelacruz.uk/2018/10/01/looking-for-the-perfect-dashboard-influxdb-telegraf-and-grafana-part-xii-native-telegraf-plugin-for-vsphere/
But in case you want a quick bullet point list:
- Make sure you have the most recent telegraf version, then read about the vSphere Plugin here - https://github.com/influxdata/telegraf/blob/master/plugins/inputs/vsphere/README.md
- Edit the vSphere Plugin and add your vCenter IP or FQDN, user and credentials, and enable the sections you want to monitor or exclude from your vSphere.
- Restart the Telegraf service
- Download the VMware vSphere Grafana Dashboards JSON file and import them into your Grafana
- Enjoy (:
- This repository it's just intended to provide the Dashboard json files and some help