
DarwinLogs is a simple population evolution simulator. A given start population goes through a number of generations. After all changes it returns statistics of all generations. This is a second version of Project Darwin.
User provides environment and population in JSON files. After all program returns plots with statistics data, output environment and population in JSON files which can be used as input data and all statistics in CSV file for further analysis.
- Input and output data is provided in JSON format. It will make web layer implementation easier and allow continuing population execution
- All program behavior issues are logged to standard output. It will make easier process of finding problems with correctly working program
- Output file is provided in the CSV format. It will make iterative processes of creating output graphs easier and allow easy fetching data in other programs
- json - JSON format manipulation
- csvfile - CSV format manipulation
- argh - flags parsing
- progress-cpp - progress bar showing
- gnuplot - plotter
- gnuplot-iostream - Gnuplot facade for plotting graphs
- libboost-all-dev - package used to connecto to plotter
- valgrind - checking memory leaks
To install Gnuplot, Boost and Valgrind run:
sudo apt-get update
sudo apt-get install -y gnuplot
sudo apt-get install -y libboost-all-dev
sudo apt-get install -y valgrind
Valgrind is not required for DarwinLogs usage. It is used in the development process to check memory leaks. Other libraries are imported locally so you do not need to bother.
cmake .
make
./darwinLogs
Program prints help if run with incorrect flags. You can also print it using -h flag. Input files format is coherent with data/pop.json and data/env.json files used for manual testing. First of them provides input population and the second input environment.
To clone the repository run:
git clone https://github.com/franpog859/darwinLogs.gitIf you are Ubuntu (or other Linux distro) user you can run test.sh script which builds, compiles and runs the program with memory leaks check.
 |
 |
|---|
We can clearly see that something bad happened around 60-th epoch. Number of people started to decrease drasticly. On the second chart we can observe that it probably was the increasing minimal dexterity needed to survive.

In the second attribute correlation chart we can observe even more clearly that the change of average attribute is related to the environment. If the need for dexterity decreases, people's dexterity decreases too. They are getting lazy. If it increases, people's dexterity increases too. We can even observe the delay of the change and therefore what causes what. People's attribute changes much later that the environment. It can cause problems as we observed in the first two charts.
 |
 |
|---|
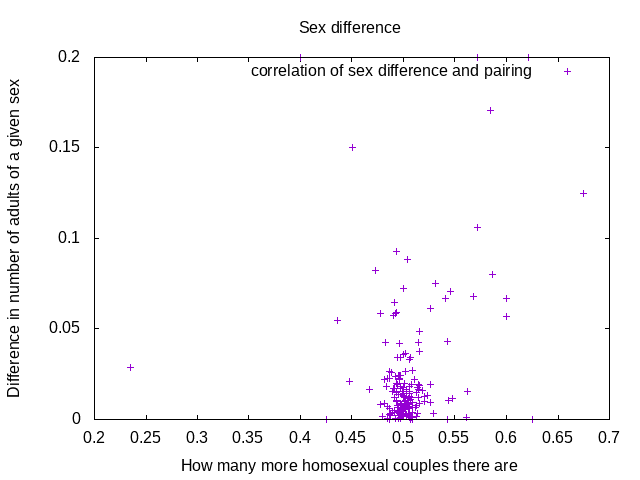
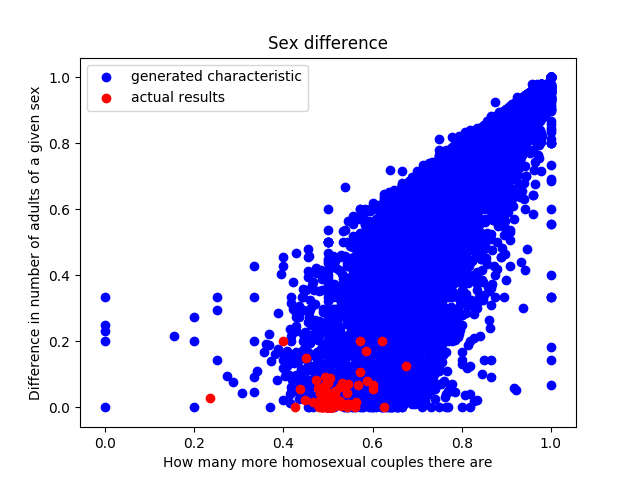
I tried to show the linear relation with sex difference and difference of number of homosexual and heterosexual couples. If the sex difference increases number of homosexual couples should increase too. Dataset is so small that you cannot observe it with naked eye! I generated the characteristic and added the results to see that it's in fact true.

If there is no need to have high survival attributes elders are dying much longer that normally. We can observe here that elders are more than 50% of the population in the 5 - 20 epoch interval. After that higher need for intelligence appeared and therefore fraction of elders in the population dropped to about 40%.