- Problem
- The Dataset
- The Models
- Recommendations
1. Motivation
A ride-sharing company is interested in predicting rider retention. To help explore this question, they provided a sample dataset of a cohort of users who signed up for an account in January 2014. The data was pulled on July 1, 2014. The company considers a user retained if they were “active” (i.e. took a trip) in the preceding 30 days (from the day the data was pulled). The task is to build a model to distinguish customers who are likely to churn based on available data and propose actionable plans to reduce churn.
2. The Dataset
The training set contains 40,000 entries and 12 columns. The following columns need work:
- The
last_trip_dateandsignup_datecolumns are strings and have to be converted to datetime. Also, I need to create Booleannot_activecolumn from these dates, which will be the target variable. - There are 162 missing ratings by drivers, 6,528 missing ratings by riders, and 319 missing phone numbers. I decided to remove rows with missing phone numbers and impute ratings using the mode of all values.
- There are two categorical features,
cityandphone. They need to be one hot encoded for some of the estimators. - Numerical features will need to be standardized for some models using StandardScaler.
The training set is imbalanced (62% of customers churn). I used AUC score as a performance metric to evaluate all classifiers and used StratifiedKFold cross-validation to make sure all classes were represented in the evaluation folds.
3. The Models
Following this flowchart, I shortlisted the following machine learning models:
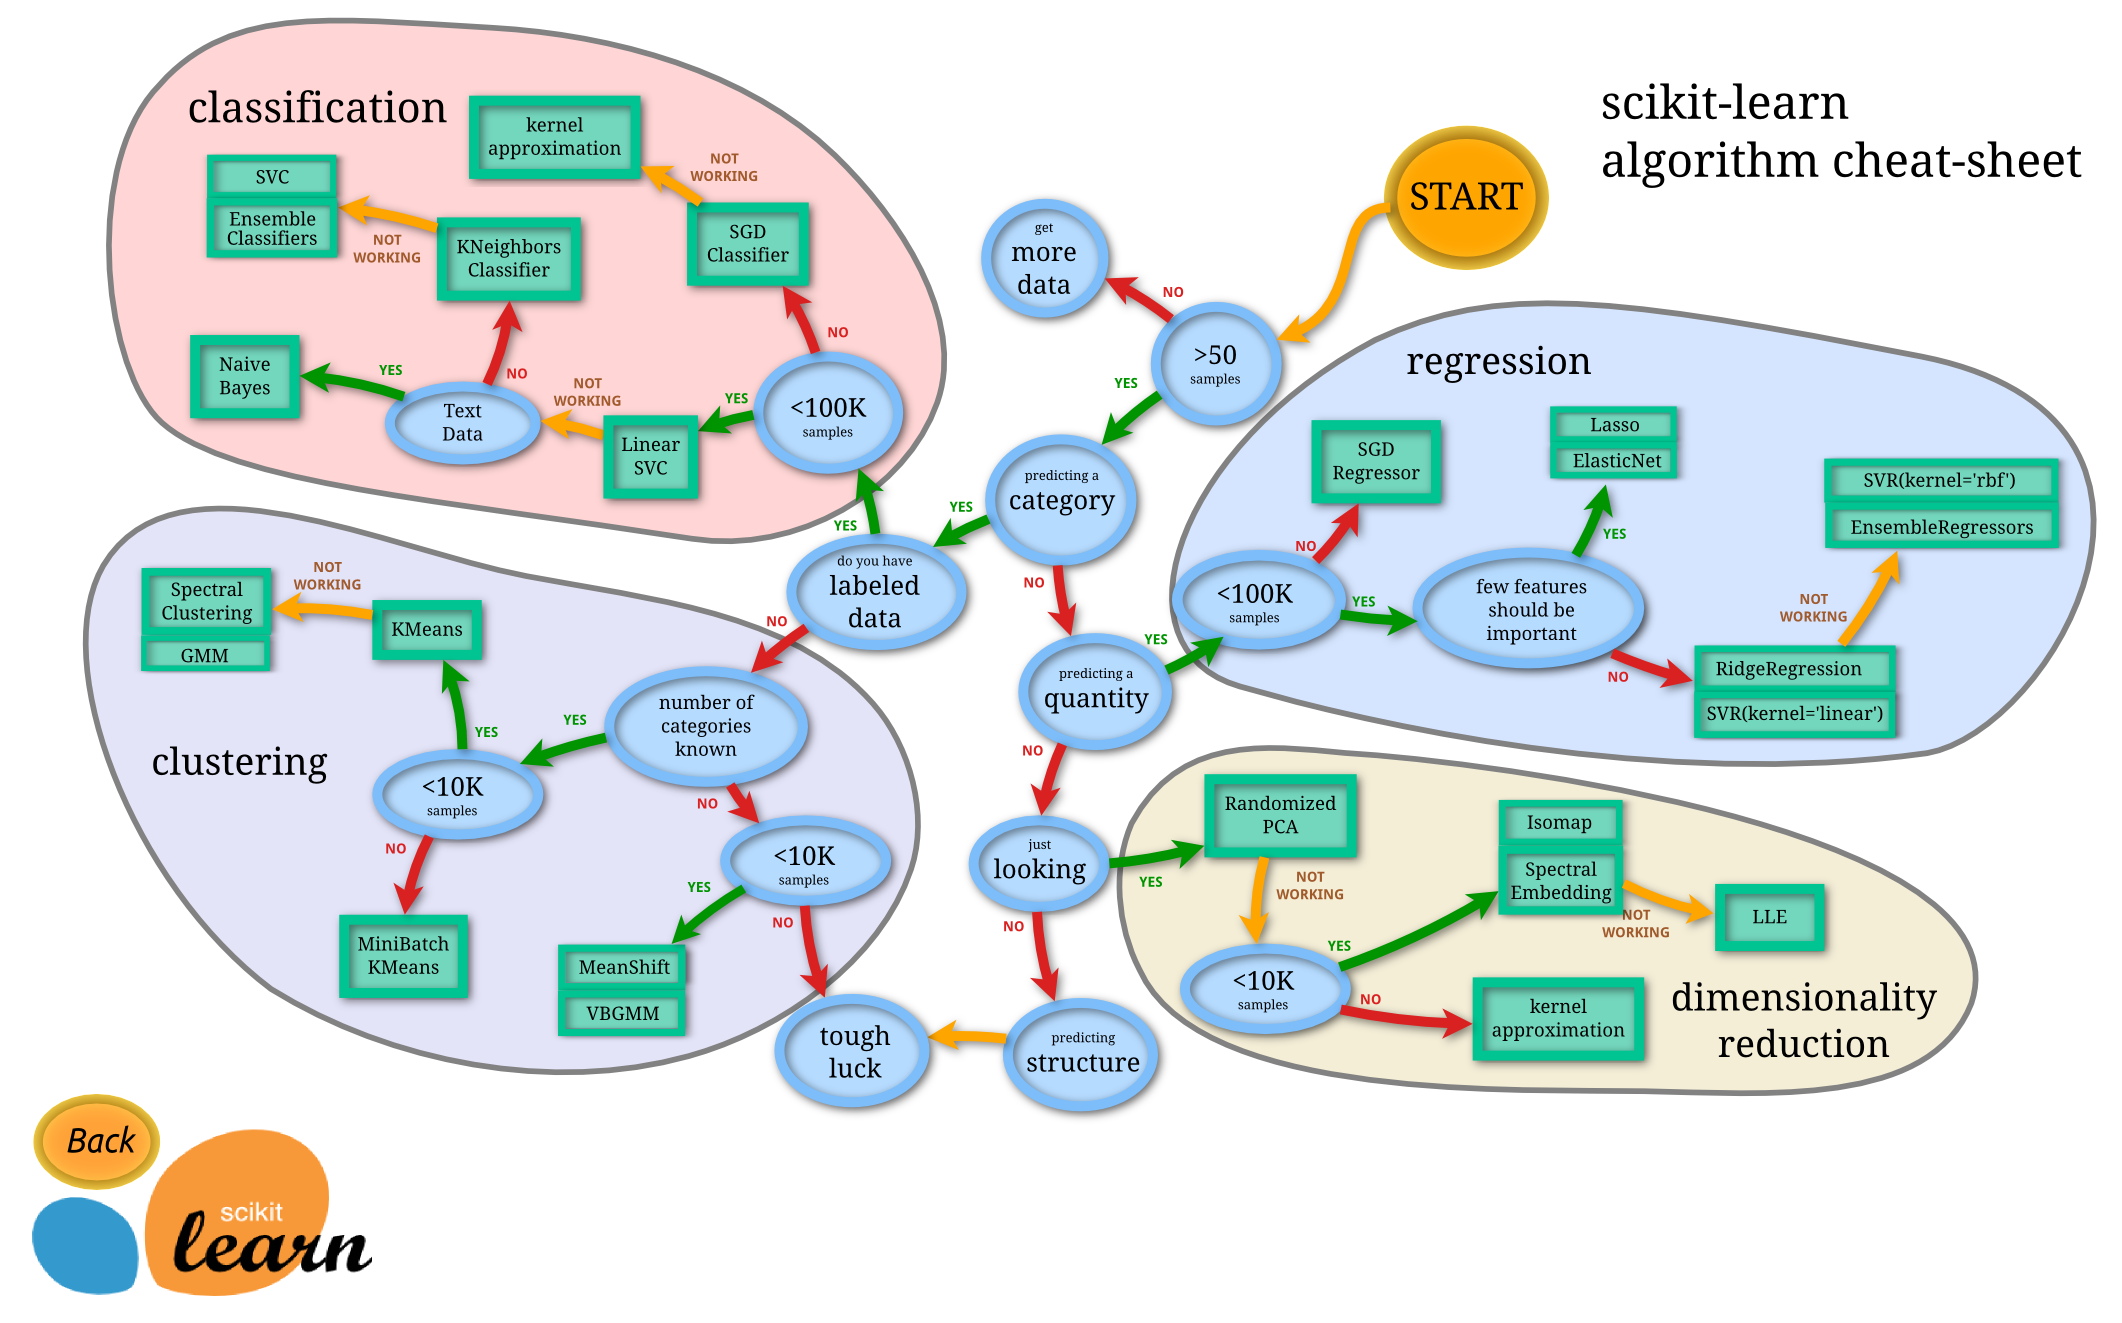
- Linear SVM
- kNN
- SGD Classifier
- Ensemble classifiers (bagged trees, random forest, adaboost, stochastic gradient boost)
- SVM (other kernels)
I selected three models for parameter fine-tuning: I tried SVM with several kernels and fine-tuned SVM, random forest, and stochastic gradient boost with GridSearch. The final ROC curves were very similar:

4. Conclusion
For promotional offers, use the Gradient Boosted Tree model to predict churn and use profit curve framework to design promotions. Basic steps of designing the promotion include:
- Normalize the confusion matrix of true positive, false, positive, false negative and true negative customer classifications to probability rates (aka, divide customer counts in each outcome by the total customer number).
- Estimate the cost or benefit of each decision the classifier can take. For instance, what is the price of a false positive error (giving a rider a retention incentive and they still depart)? Or a false negative error (losing a customer because no incentive was offered)?
- Once expected rates and cost/benefit information are in place, they can be used to create expected profits.
- Once expected profits are calculated, it is far easier to pick the best probability threshold to generate the highest expected profit with a limited marketing budget. Here's a great image summarizing the profit curve framework from "Data Science for Business":
For more on expected values, with excellent illustrations, great tips and warnings, see Chapters 7-8 in this amazing book "Data Science for Business: What You Need to Know": http://shop.oreilly.com/product/0636920028918.do