A workflow to use exometabolomics data collected over the growth curve of a bacterial species to predict how a co-culture of bacteria will deplete resources in a medium or environment
This workflow is described in the publication:
Dynamic substrate preferences predict metabolic properties of a simple microbial consortium. (2017) Onur Erbilgin, Benjamin P. Bowen, Suzanne M. Kosina, Stefan Jenkins, Rebecca K. Lau, Trent R. Northen. (2017) BMC Bioinformatics 18:57 DOI: 10.1186/s12859-017-1478-2
- Python 2.7
- Pandas
- NumPy
- SciPy
- MatPlotLib
- Compound concentrations for each species, replicate, and timepoint
- Example file:
Data/20151130_OAM1_QuantResults_v2C.csv
- Example file:
- Biomass measurements for each species, replicate, and timepoint
- Example file:
Data/20151014_3B10_9B05_L13_timecourse.csv
- Example file:
- Growth rate (average and error) of each species on individual carbon sources
- Example file:
Data/singleresource_data.xlsx
- Example file:
- Starting molarity of each compound in the growth medium
- Example file:
Data/molarity.txt
- Example file:
- Percent amino acid composition of the translated genome of each species
- Example file:
Data/percent_AA_composition_genome.xlsx
- Example file:
- Experimental observations of metabolite usage of the co-culture, to compare predictions
- Example file: averaged:
./data/20160328_Enigma_coculture_avg_v2.csv - Example file: standard error:
./data/20160328_Enigma_coculture_stderr_v2.csv
- Example file: averaged:
- Reads in metabolomics data and organizes it into a dictionary
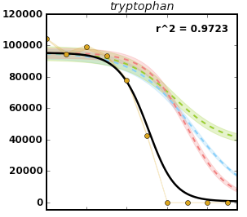
- Fits the metabolomics data to a published model of resource depletion
- Calculates "T-half" (time of half depletion)
- Calculates "Usage Window" (time of resource usage)
- Calculates maximum resource depletion rate relative to biomass
- Plots average T-half and Usage Window on the average growth curve of each species
- Plots T-half, growth rate on a single resource, maximum uptake rate, starting molarity of compound, and percent amino acid composition against each other
- Calculates correlation coefficients and p-values of the comparisons
- Using metabolomics data collected on single-species growth (Notebooks 1 and 2), predict how a co-culture of the different species would deplete resources in the same medium
- See LICENSE.txt and COPYRIGHT.txt
