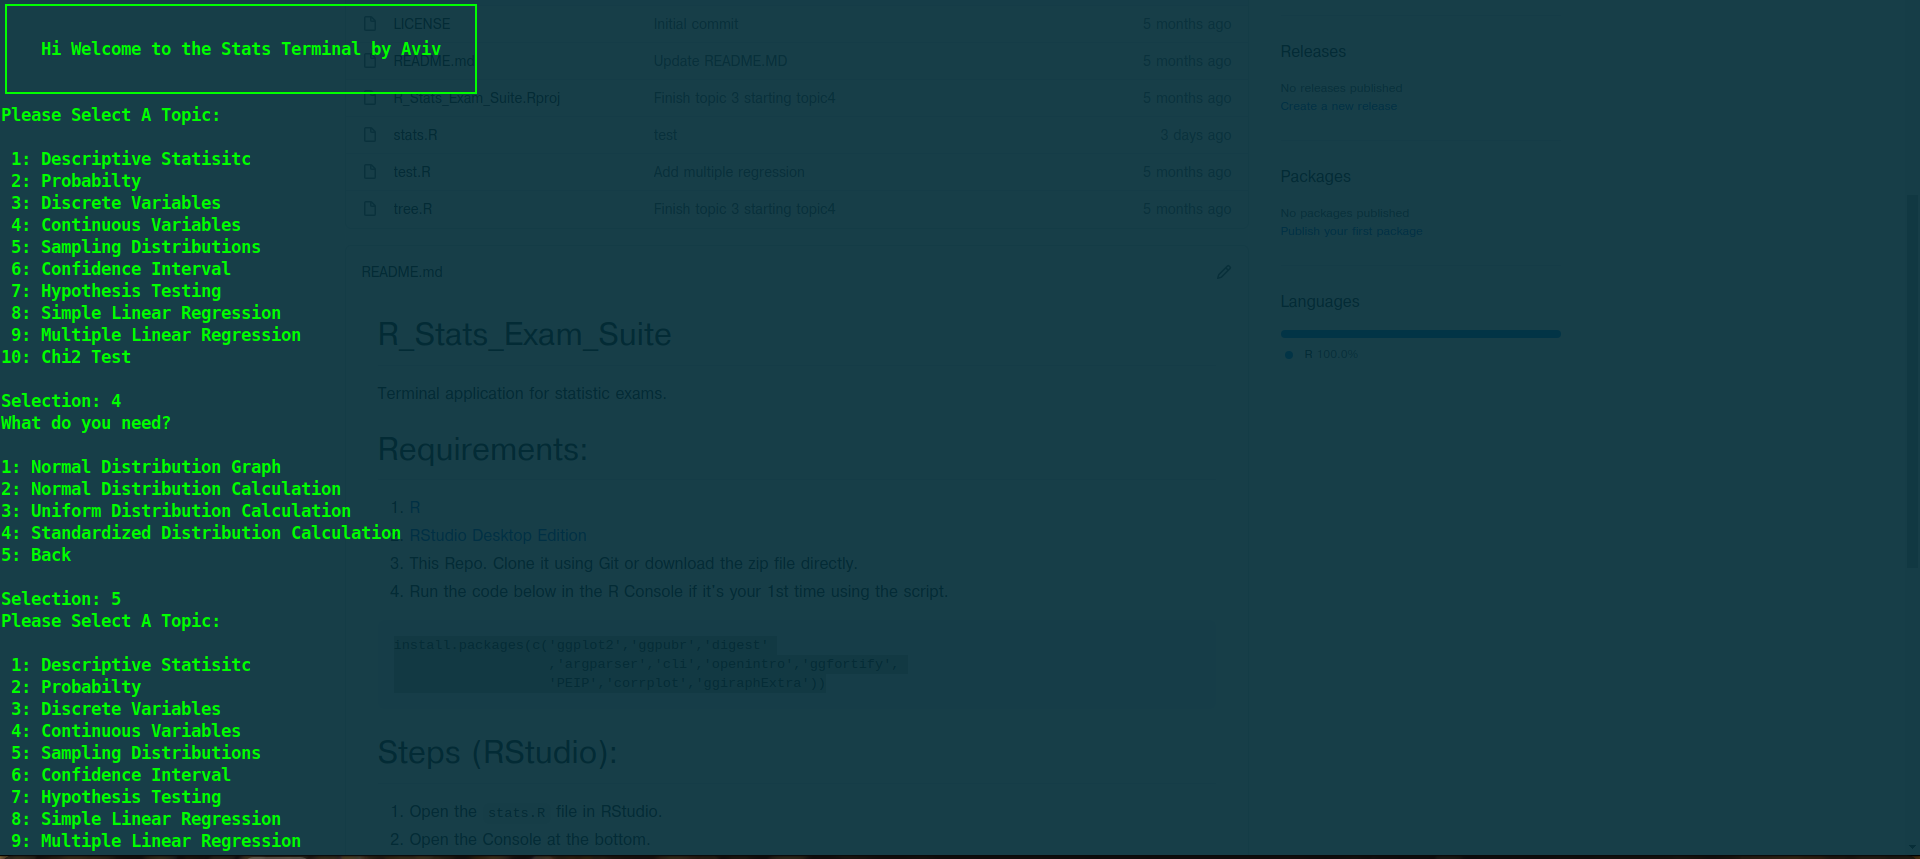
Terminal application for university statistic exams.
There are many typos in the actual menu in the application
- Descriptive Statistic
- Probability
- Discrete Variables
- Continuous Variables
- Sampling Distributions
- Confidence Interval
- Hypothesis Testing
- Simple Linear Regression
- Multiple Linear Regression
- Chi2 Test
- The sample files can be found in th
samplesfolderMultiple_Regression.xlsx(the exercise file)sanitized_data.csv(the file with processed data)
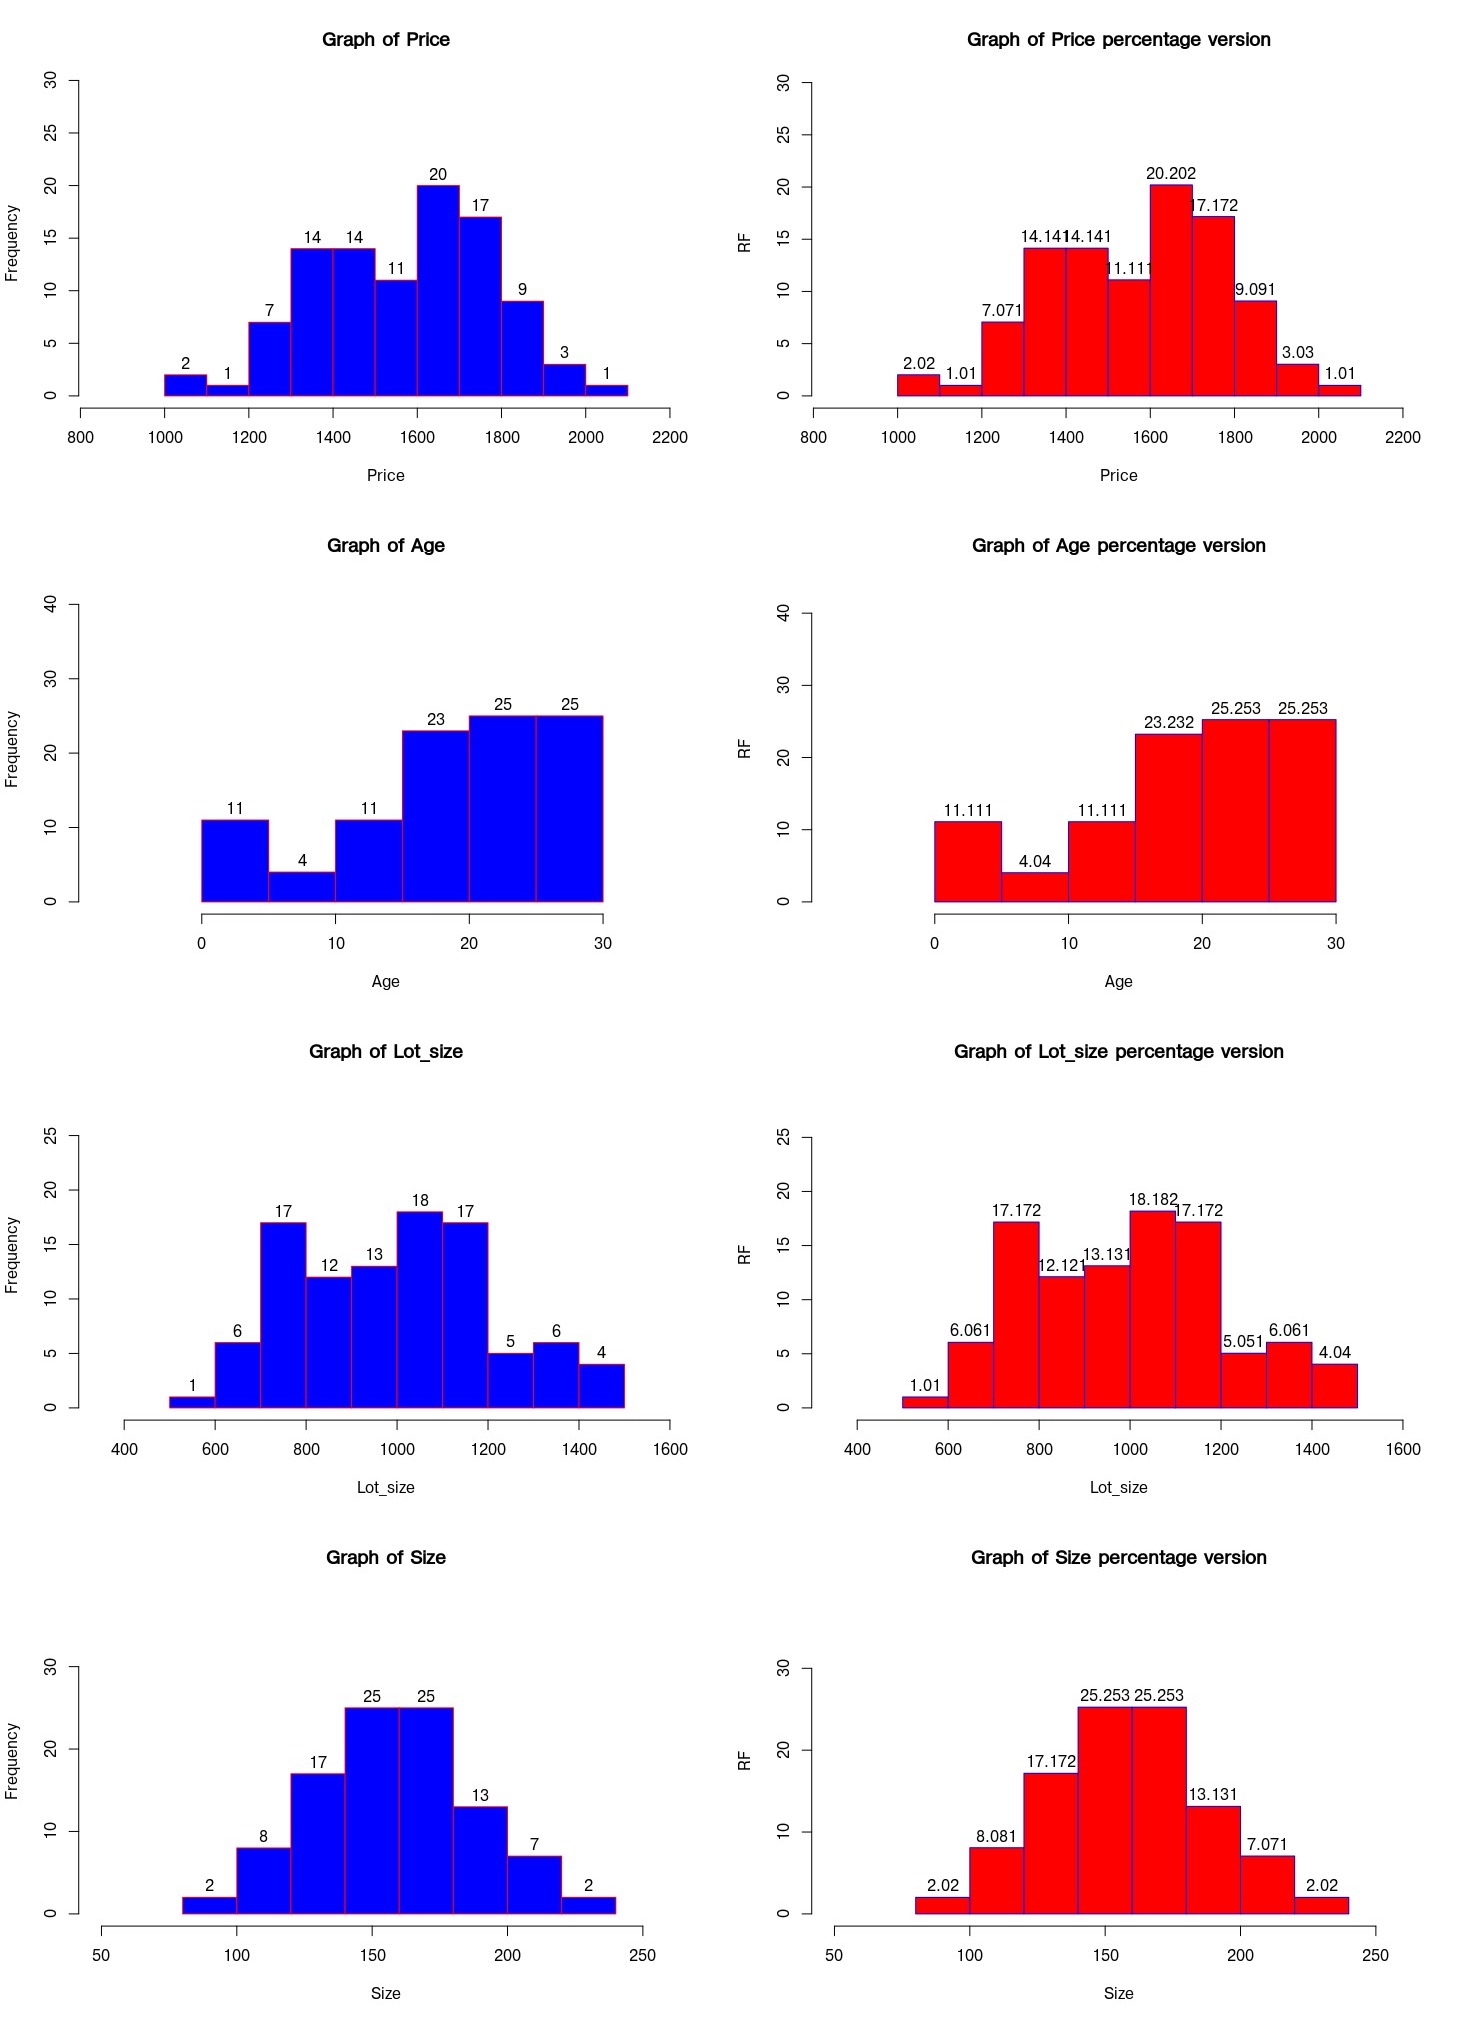
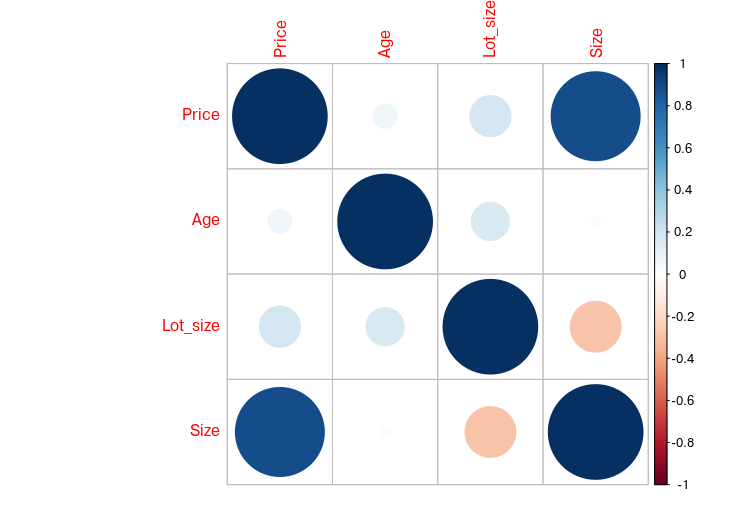
- In a real estate agency, the manager wants to analyze the price of houses depending on the age of the house, the size of the land lot and the size of living space.
- Right Open
- Right Closed
- Right Open (UpperLimitOnly)
- Right Closed (UpperLimitOnly)
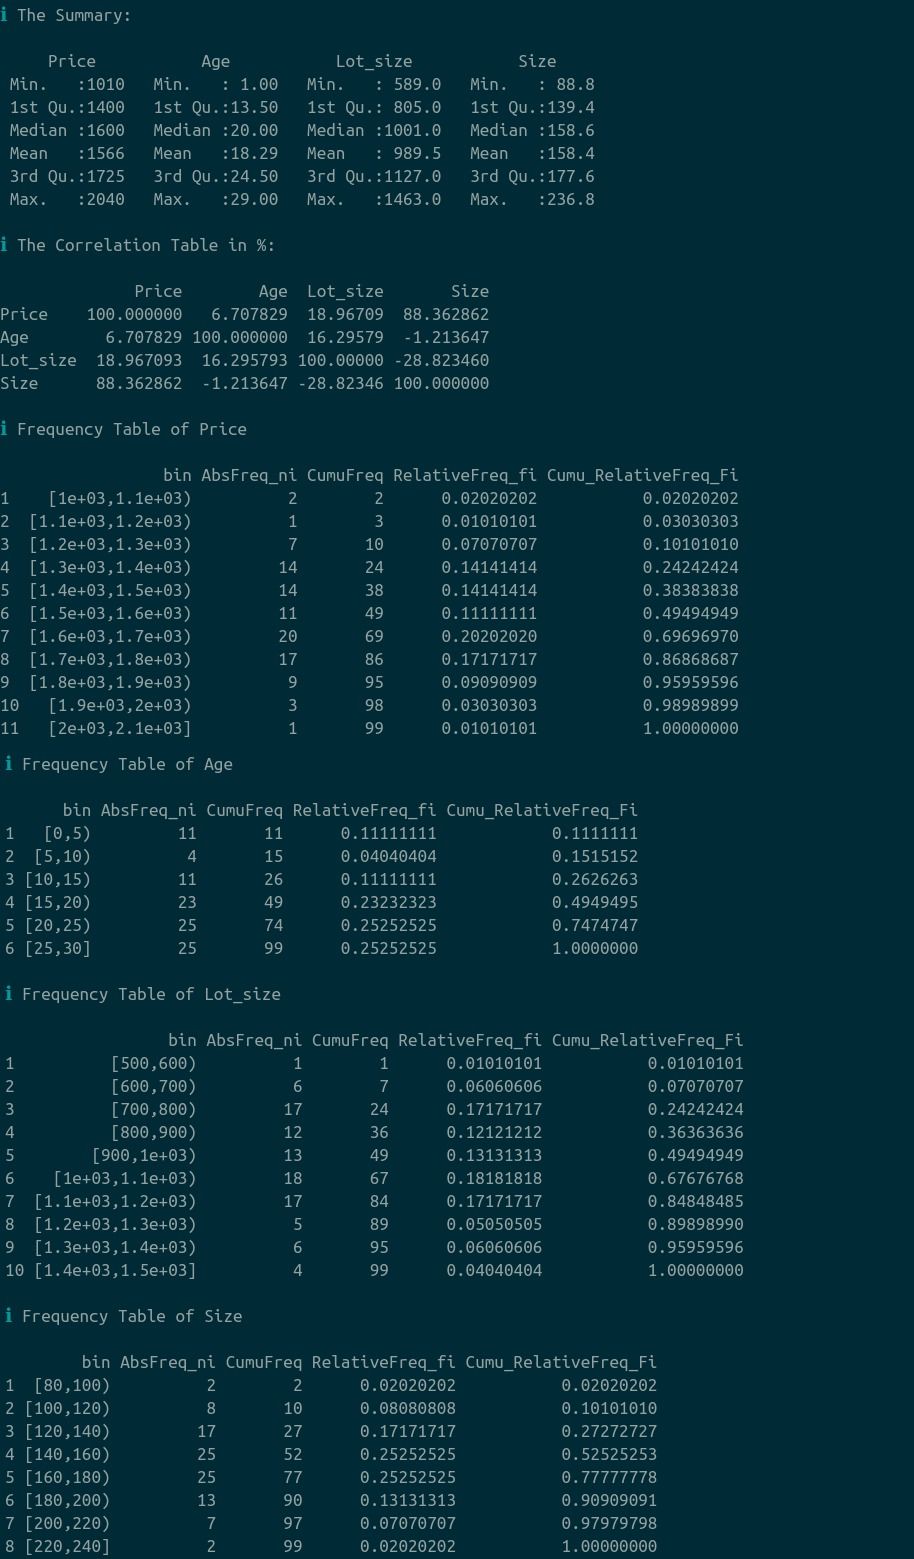
The table is truncated as it is too long
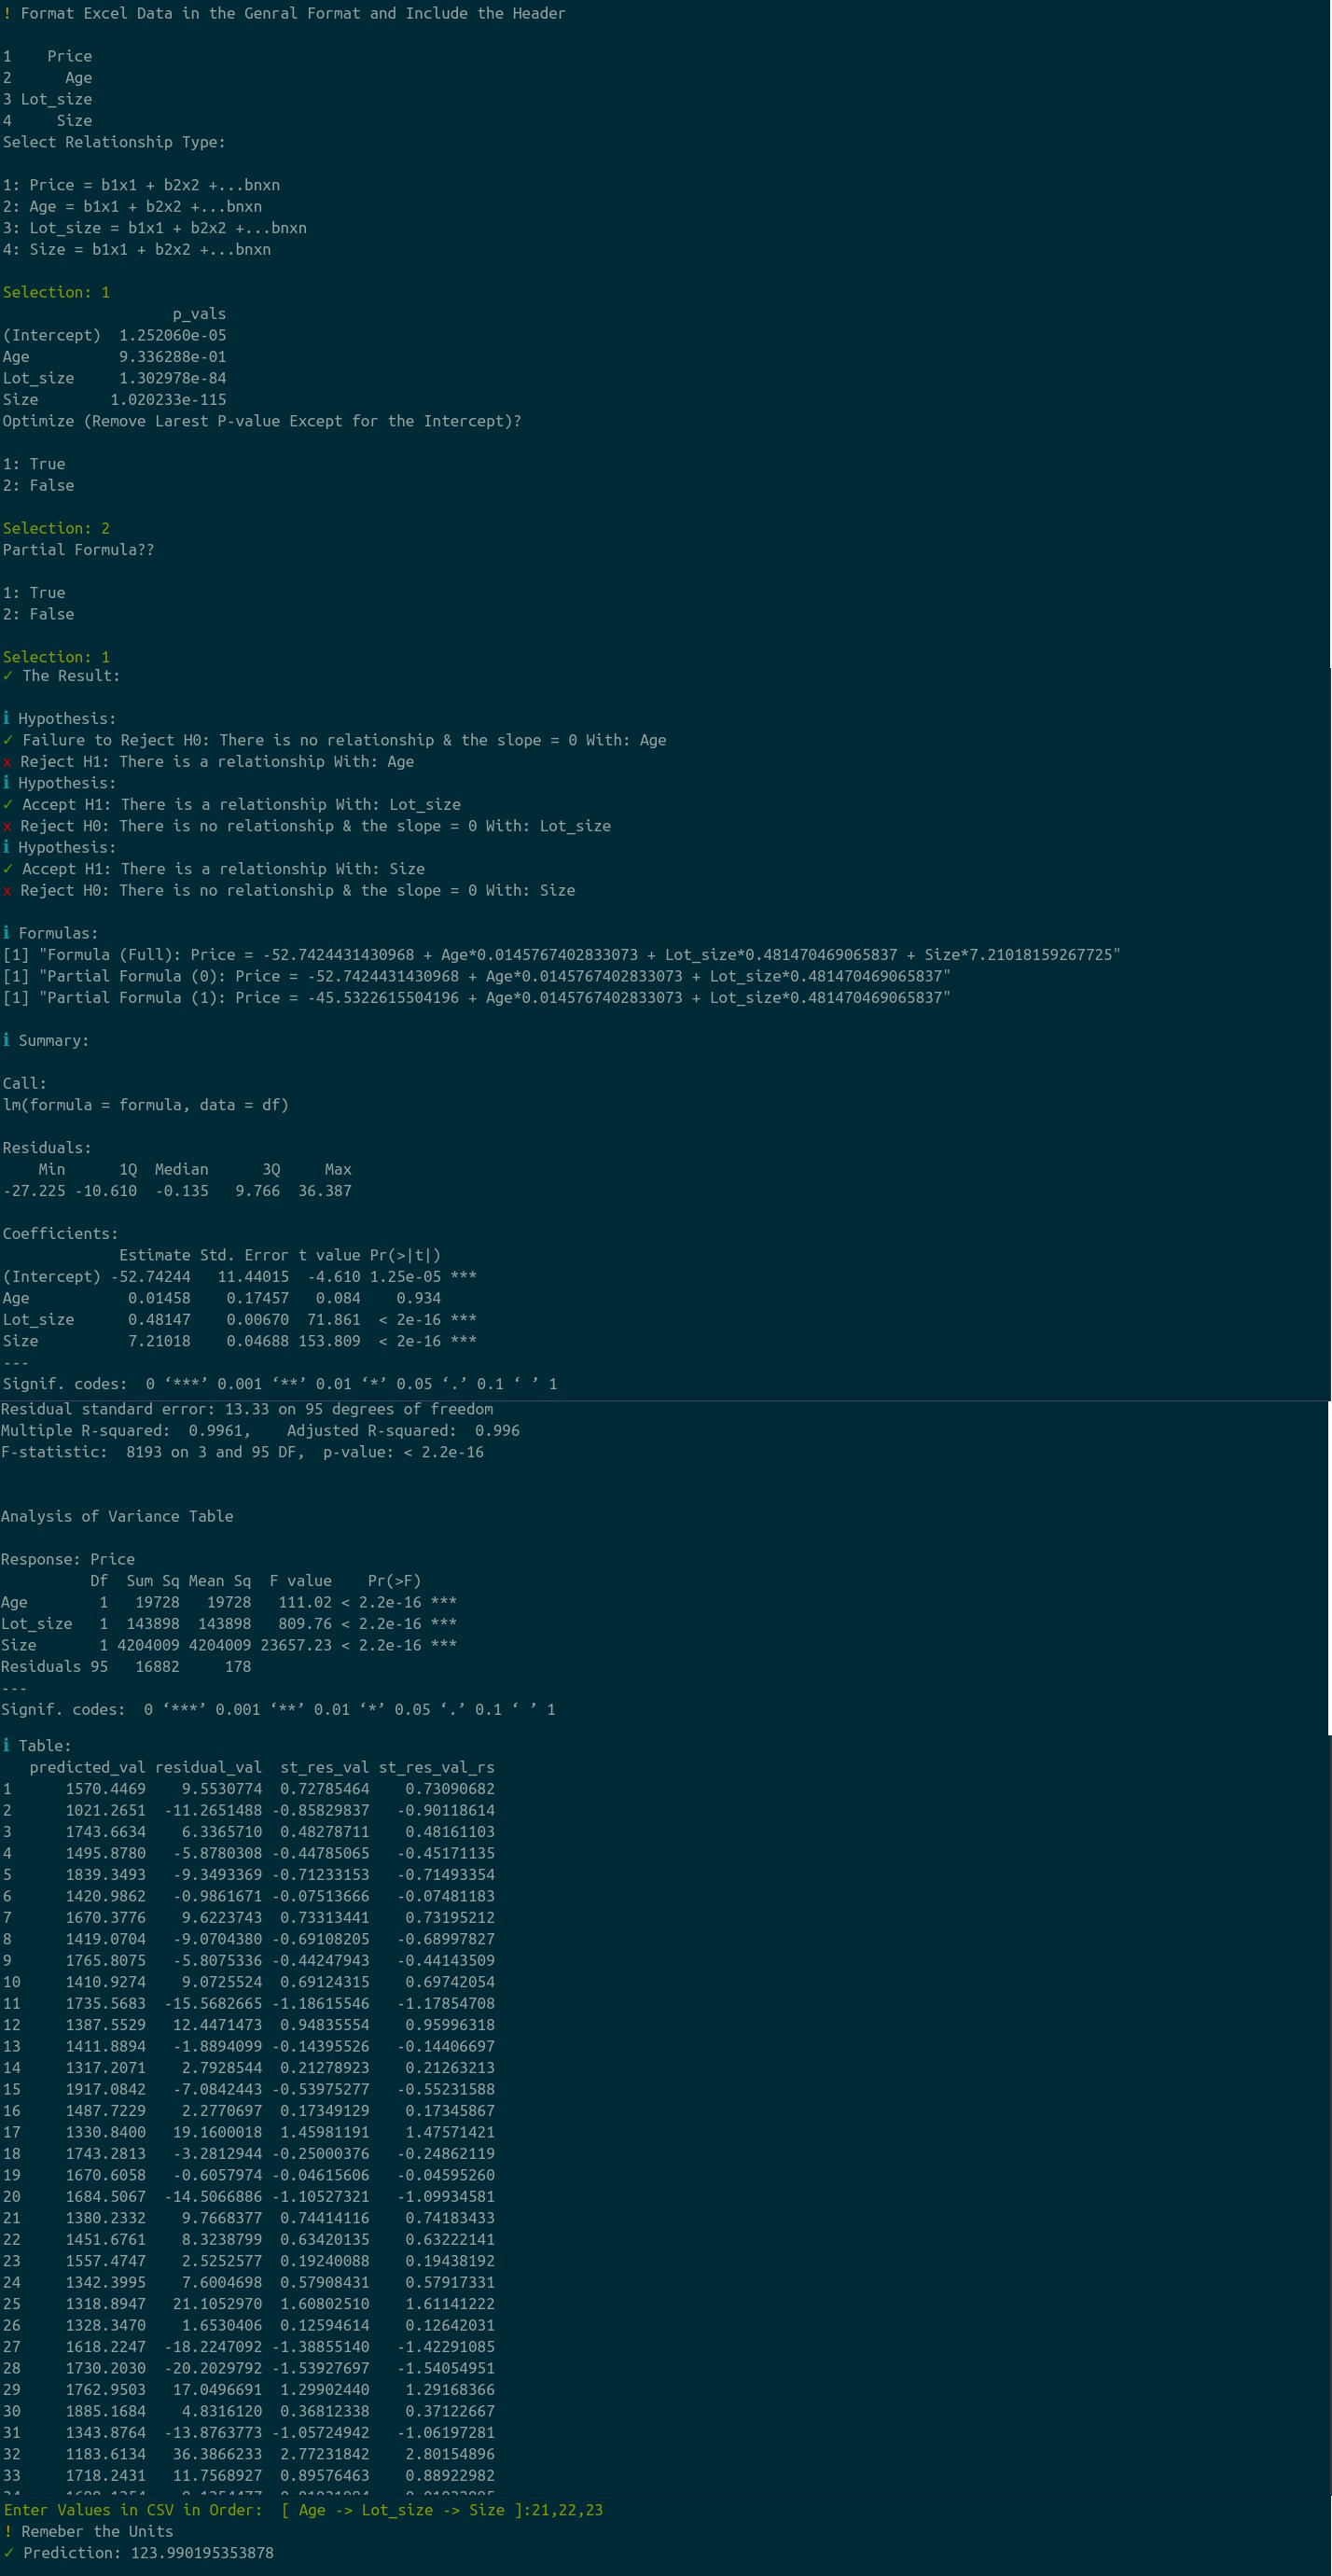 You can enter the values in CSV directly to get your prediction result.
- R
- RStudio Desktop Edition
- This Repo. Clone it using Git or download the zip file directly.
- Run the code below in the R Console if it's your 1st time using the script.
install.packages(c('ggplot2','ggpubr','digest'
                   ,'argparser','cli','openintro','ggfortify',
'PEIP','corrplot','ggiraphExtra'))- Open the
stats.Rfile in RStudio. - Open the Console at the bottom.
- Type in
source('stats.R').
- Open your terminal
- Navigate to the directory where the files are.
- Open R in the terminal by typing in
R - Type in
source('stats.R')
- The CSV file should be clean when importing, otherwise the program will not function properly.
- Check there is no hidden data is the blank cells (newline character / NAs)
- Format all the data in Excel's Genearl format.
- The program is still in the Beta stage and is not bug-free.