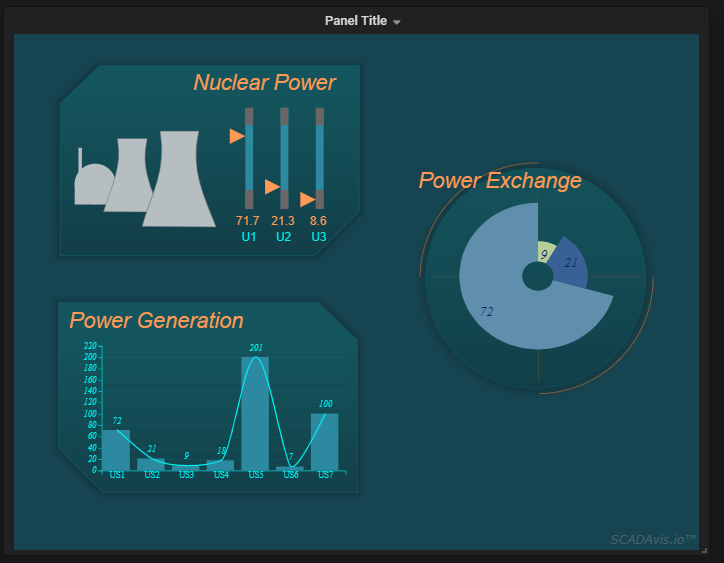
This panel plugin allows unleashing the power of SCADA-like graphics in Grafana.
The SCADAvis.io online service provides an incredibly powerful SVG Editor that can be used to create free-form graphics animated with Grafana data.
Learn how to obtain and use the SCADAvis.io editor here.
In the SVG file, graphical objects should be marked with tags that match metrics or aliases names from Grafana data queries.
Step-by-step example:
- Create a new SVG file using the SCADAvis.io Synoptic Editor.
- Put a text object the top left position.
- Change the text to %f (use printf convention to format numbers).
- Select the text object and click the right mouse button, choose "Object Properties".
- Go to the "Get" tab and type in the "Tag" field some tag name such as "TAG1".
- Save the SVG file (do not change the default format).
- Upload the file to some server to make it available online (you can use a Github raw url such as "https://raw.githubusercontent.com/riclolsen/displayfiles/master/helloworld.svg").
- Edit the Grafana panel with the SCADAvis.io plugin.
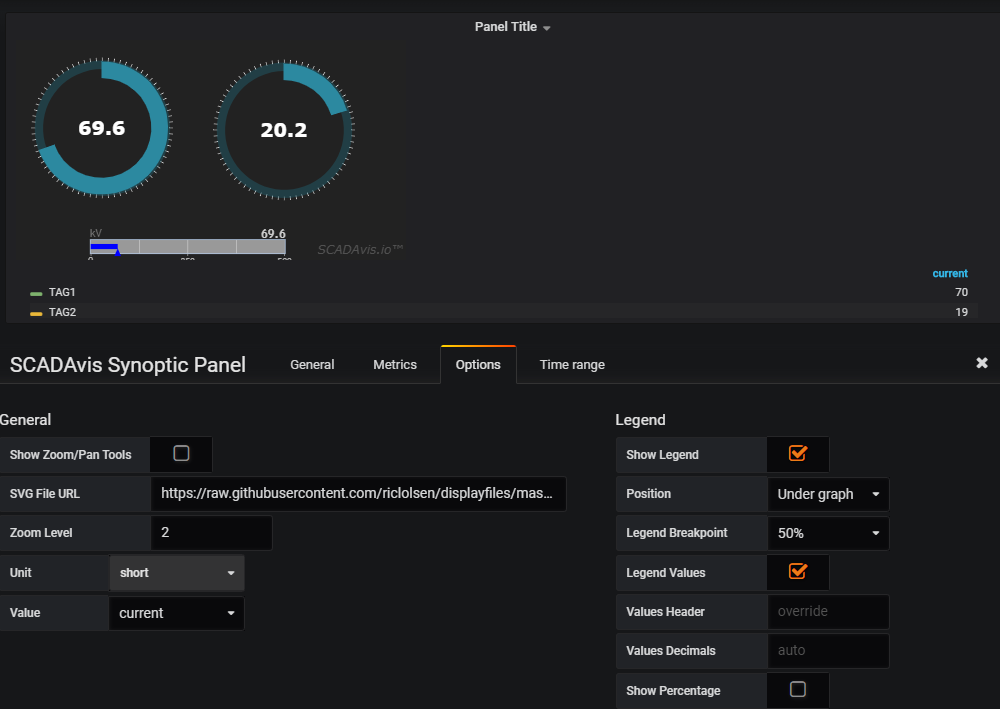
- In the "Options" tab, field "SVG File URL", enter the URL for your SVG file.
- To embed the SVG file in the panel, first convert the SVG contents to Base64 encoding (there are online encoders) and paste the results in the SVG File URL field.
- In the "Metrics" choose a Data Source and use the tag name that is inside the SVG file (e.g. "TAG1") as the metric name. Example query: "SELECT as value, "TAG1" as metric FROM ...".
- Save the panel and it will display the value obtained from the query in the panel as a float value.
- There are many animations possible such as filll/stroke color, position, opacity, etc. (see "Learn" section on https://scadavis.io site).
This plugin requires Internet connectivity to work properly!
Use the new grafana-cli tool to install scadavis-synoptic-panel from the commandline:
grafana-cli plugins install scadavis-synoptic-panel
The plugin will be installed into your grafana plugins directory; the default is /var/lib/grafana/plugins if you installed the grafana package.
More instructions on the cli tool can be found here.
You need the lastest grafana build for Grafana 3.0 to enable plugin support. You can get it here : http://grafana.org/download/builds.html
It is also possible to clone this repo directly into your plugins directory.
Afterwards restart grafana-server and the plugin should be automatically detected and used.
git clone https://github.com/riclolsen/scadavis-synoptic-panel.git
sudo service grafana-server restart
If the plugin is cloned to a directory that is not the default plugins directory then you need to edit your grafana.ini config file (Default location is at /etc/grafana/grafana.ini) and add this:
[plugin.scadavissynoptic]
path = /home/your/clone/dir/scadavis-synoptic-panel
Note that if you clone it into the grafana plugins directory you do not need to add the above config option. That is only if you want to place the plugin in a directory outside the standard plugins directory. Be aware that grafana-server needs read access to the directory.
- Added "Load SVG from local file" config option.
- Better auto resize handling.
- Compatible also with Grafana 6.7.
- Added "Auto Resize" config option.
- Supported Grafana Templating Variables.
- More efficient data update and display rendering.
- Generic tagging (@1, @2, @3, ...) compatible to the Power BI plugin.
- Better responsiveness to configuration changes.
- Better README.md.
- Revised version. Watermark removed.
- Initial version.