![]()

NeatMap is a plugin for QGIS that allows the production of an "organized" set of polygon features according to their shapes. In order to proceed, three steps are necessary : 1/ morphological indicators calculation, 2/ classification of the polygon features using these indicators and 3/ generation of the disposition of the features.
The project is developed as an Open-Source library based on :
- QGIS API V3.0, for morphological operators and layout generation ;
- Scikit learn 0.19.1 : for the classification. Normally, the installation of thie library is automatic but if it fails, please refer to the installation guide.

This research library has been initiated during a ENSG student work and continues with COGIT team research developments.
The layout idea was based on the artistic work of Armel Caron : tidy cities and the aim is to question the ability of automatic algorithms to generate similar layouts. The idea is not to produce on-demand art, but to asses the expressivity of common morphological indicators to discriminate polygon shapes and the part of subjectivity in the original artistic productions.

The general idea of the approach is to regroup the feature with similar characteristics into groups and to correctly arrange these groups. These characteristics are assessed through a set of morphological indicators and the groups are created with a classification method. Inside the group, an attribute is used to rank the different features (for example, the area in the image presenting the principle). Each group can be modeled as a rectangle and the aim of the layout generator is to find an optimal way to arrange these rectangles.

The plugin is composed of 3 steps :
- (1) the calculation of common morphological indicators on a polygon layer ;
- (2) the classification through a k-mean method ;
- (3) the generation of classified layouts. If these three steps are consecutive, they can be run independently if a layer with the relevant attributes is provided. For example, if you have produced your own indicators, you can directly proceed to the classification or if your features are already classified to generate a layout with them.
The only requirement is to get QGIS 3.3 or later installed. You can download it from QGIS official website.
Currently the plugin is on QGIS repositories as an experimental plugin Neatmap page on QGIS repo.
You can also install it manually. You have to download the automatically generated zip file and to unzip it in the plugins folder (https://gis.stackexchange.com/questions/274311/qgis-3-plugin-folder-location).
In QGIS, in the "Extenion" menu > "Install Extension" option, you have just to activate the "NeatMap" plugin.
NOTE : if the plugin is mising, you may have to allow experimental plugins, in the parameter menu.
The GUI of the plugin is basically composed of three parts that reflect the three steps of the workflow (indicator calculation, classification and layout generation). Each part has its own options and one "Ok" button that allows to run separately the different steps.
Note : the option "Copy attributes between two steps" is a general option. It allows to keep the attribute of the layer between two steps and works for each step.

This steps aims at calculating morphological indicators from a polygon layer.
It requires as input :
- Input layer : The name of a polygon layer with an ID field ;
- Output layer name : The name of the output layer ;
- ID attribute : The name of the attribute field.
By clicking on the "Ok" button of this section, a new layer with the following indicators is produced and added in QGIS :
- area : the area of the geometry ;
- SMBR_area : the area of the smallest bounding rectangle ;
- SMBR_angle : the orientation of the smallest bounding rectangle ;
- SMBR_h : the height of the smallest bounding rectangle ;
- SMBR_w : the width of the smallest bounding rectangle ;
- convexity1 : convexity relative to the convex hull ;
- convexity2 : convexity relative to the smallest bounding rectangle ;
- elongation : elongation of the building (between 0 and 1) ;
- compact : compactness of the polygon ;
- area/perim : ratio between area and perimeter ;
- complexity : the number of segments of the polygon.
This step determines different classes of features through a k-mean classification method.
It requires as input :
- Input layer : The name of a polygon layer with an ID field ;
- ID attribute : The name of the attribute field ;
- In the central panel, a list of numerical attributes can be selected. You can use the indicators calculated during the previsous step, your own indicators or a combination of both. During the process, the attribute values are scaled between 0 and 1;
- Number of classes : the number of classes in which the features will be classified. This parameter is very important as it defines the number of groups used to produce the final layout ;
- Classification attribute : a new attribute that stored the identifiant of the different classes ;
- Output layer name : The name of the output layer.
By clicking on the "Ok" button of the section, a new layer will be produced. It contains a new attribute that informs about the class of the features and the attributes used for classification.
An example of classification of the world countries with 10 classes :

This step aims at generating a layout according to a classification attribute (you can use your own classification made by an other method or the one produced by the preivous step).
The required information are :
- The type of algorithm : two layout algorithm are available ;
- Input layer : The name of a 1perline.png layer with an ID field ;
- Classification attribute : The name of the attribute where the classes are described (this attribute can be generated from the previous step or an other method) ;
- Secondary ranking attribute : The attribute that classify the polygon among a class (refer to "Principle section). This attribute must be numerical.
- Output layer name : The name of the output layer.
By clicking on the "Ok" button of the section, a new layer will be produced, with a new layout according to the choosen method, the layer has the same CRS as the input one
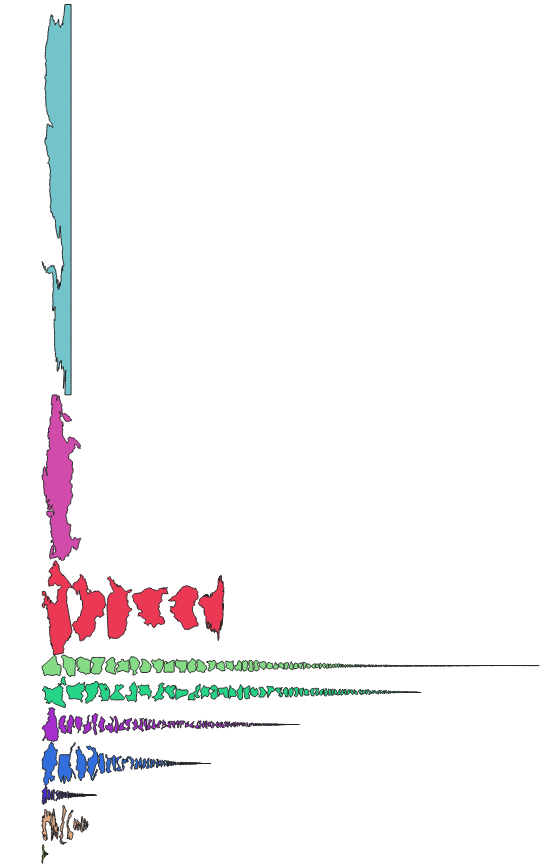
The first method is very basic and generate a layout for which each class is on a line and the different features follow the line ordered according to the secondary attribute.
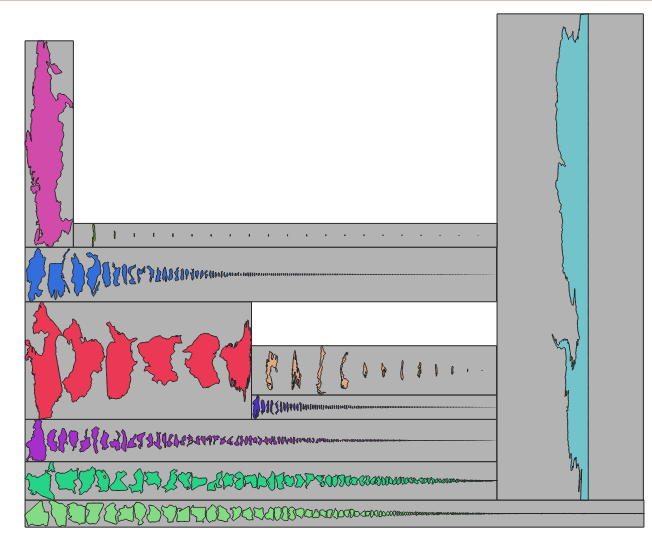
This method aims at producing the layout that is contained into the minimal possible rectangle. As each class is contained into a bounding rectangle, this problem is of the class of rectangle packing problems. In our implementation, we use the Chazelle (1983) heuristics to packing the rectangle of the classes.
Chazelle, B., 1983, The Bottom-left Bin-packing Heuristic : An Efficient Implementation, IEEE Transactions on Computers, Volume 32 Issue 8, August 1983 Pages 697-707
The following image presents the application of the Chazelle method on the rectangle of each class from the previous classification and their related features.

As the occupation of the layout is not optimal, we implemented an extension method that increases the width of the rectangle and applies the transformation on their related features.
Warning : this method produces optimized results but is very time consuming, we do not advice to use this method when the number of class is greater than 15.
This method is similar than the previons one. The method is very fast but the results are less optimized in terms of layout area. The extent width is determined according to the widest class. Then the method is a greedy placement by decreasing width.
A post-process phase is applied once all classes are placed and extend the extent of the different classes until it is possible (i.e. it does not intersect an other class extent). Then the objects that belongs to this class are added and horizontally distributed in the class extent.
The code can be used as a standalone application, globally the code is splitted into several python files :
- morpho.py : the file that contain the calculation of the morphological indicators ;
- indicatorCalculation.py : the file that create new layers with the morphological indicators ;
- classification.py : the file that contains the feature classificatino with scikit-learn ;
- square_packing.py : this file contains the method to produce the output layout ;
- neatmap.py : the code of the QGIS plugin
The following script shows how to use the code through the most important functions. The full code is available in the file app.py. It can be directly run as it with data from data_test directory.
layer_polygons = QgsVectorLayer(os.path.join(input_dir,'world.shp'), 'polygons', 'ogr')

#Export layout
crs=QgsCoordinateReferenceSystem("epsg:-1")

#Step 1 : calculating indicator
# (layerName) => The name of the output layer
# (layer_polygons) => The input layer
# (fid_atribute) => The name of the fid attribute
# (True) => Means that all attributes will be copied
layerOut = calculate(layerName,layer_polygons,fid_atribute, True);

#Export features with attributes
error = QgsVectorFileWriter.writeAsVectorFormat(layerOut, os.path.join(output_dir,"indicator.shp"),"utf-8", layerOut.crs(), "ESRI Shapefile")


#Determining the attribute to use for the classification
attributes = ["area", "elongation" , "compact."]
#Output classification attribute
classAttribute = "class"

#Step 2 : Applying the classification
# (layerOut) : the input layer (the output from previous step)
# (attributes) : the list of attributes on which the classification will be proceeded
# (10) : the number of classes
# (layerName) : the name of the output layer name
# (classAttribute) : the name of the attribute in which the class will be stored)
# f(id_atribute) => The name of the fid attribute
# (True) => Means that all attributes will be copied
layerClassified = kmeans(layerOut, attributes, 10, layerName, classAttribute, fid_atribute, True)

#Export features with  classificatinoadvanced_layout
error = QgsVectorFileWriter.writeAsVectorFormat(layerClassified, os.path.join(output_dir,"classified.shp"),"utf-8", layerClassified.crs(), "ESRI Shapefile")


#Step 3 ! Applying a naive layout
#Secondary attribute to sort the feature (descending)
attSecondary = "area"

# (layerClassified) : the input layer (the output from previous step)
# (classAttribute) : the name of the attribute in which the class will be stored)
# (attSecondary) : the secondary ranking attribute
# (layerName) : the name of the output layer name
# (True) => Means that all attributes will be copied
newLayoutLayer = naive_layout(layerClassified, classAttribute , attSecondary, layerName, True)

#Naive layout
error = QgsVectorFileWriter.writeAsVectorFormat(newLayoutLayer, os.path.join(output_dir,"naiveLayout.shp"),"utf-8", crs, "ESRI Shapefile")


#Step 3 bis : other layout method (with the bounding boxes to debug the rectangle packing)
# (layerClassified) : the input layer (the output from previous step)
# (classAttribute) : the name of the attribute in which the class will be stored)
# (attSecondary) : the secondary ranking attribute
# (layerName) : the name of the output layer name
# (True) => Means that all attributes will be copied
otherLayout, layoutBoundingBox = advanced_layout(layerClassified, classAttribute , attSecondary, layerName, True)

#Bounding boxes used for pack layout production
error = QgsVectorFileWriter.writeAsVectorFormat(layoutBoundingBox, os.path.join(output_dir,"boundingBox.shp"),"utf-8", crs, "ESRI Shapefile")


#Packed layout
error = QgsVectorFileWriter.writeAsVectorFormat(otherLayout, os.path.join(output_dir,"otherLayout.shp"),"utf-8", crs, "ESRI Shapefile")

#Step 3 ter : other layout method, less optimal that in Step 3 bis. The widestbox is placed at first and the other one
#Are placed on this box, according to the x axis etc (like making a wall with bricks)
# (layerClassified) : the input layer (the output from previous step)
# (classAttribute) : the name of the attribute in which the class will be stored)
# (attSecondary) : the secondary ranking attribute
# (layerName) : the name of the output layer name
# (True) => Means that all attributes will be copied
otherLayout2, layoutBoundingBox2 = fast_layout(layerClassified, classAttribute , attSecondary, layerName, True)

#Bounding boxes used for fast layout production
error = QgsVectorFileWriter.writeAsVectorFormat(layoutBoundingBox2, os.path.join(output_dir,"boundingBox2.shp"),"utf-8", crs, "ESRI Shapefile")


#Packed layout
error = QgsVectorFileWriter.writeAsVectorFormat(otherLayout2, os.path.join(output_dir,"otherLayout2.shp"),"utf-8", crs, "ESRI Shapefile")

qgs.exitQgis()- World countries : the intial dataset is available on Thematic Mapping Website but multi-polygon features are splitted into polygon features.
- Pars blocks : this is an extract of Paris blocks generated by agregation of a small buffer from the French Open-Source Cadastre Dataset
If you have somer interesting datasets that suit well with the approach do not hesitate to contact us (and if you produce some interesting results).
This software is free to use under licensed under the GPL version 3.0 or greater. However, if you use this library in a research paper, you are kindly requested to acknowledge the use of this software.
Furthermore, we are interested in every feedbacks about this library if you find it useful, if you want to contribute or if you have some suggestions to improve it.
Mickaël Brasebin & Julien Perret LASTIG Laboratory
- Rose Mathelier and Bruce Thomas from ENSG. Development of a very first version with static classification method and simple layout.
- Using other classification technics as lots of different ones are implemented in Scikit learn 0.19.1
- Error during indicators calculation step : you need to use a layer with polygon (and not multi-polygon), non-empty and well formed geometries