[FEATURE] generate service_maps from otel_metrics_source #5055
Comments
|
Data Prepper is currently constructing the service map from the span data. It determines which services are connected by following the spans within a trace. From this data, it constructs its own representation of the service map. @AdaptiveStep Do I understand you correctly, that you want a processor, that recognises the metrics emitted by the OpenTelemetry Collector Service Graph Connector and transform them into the service graph used by the OpenSearch observability plugin? |
|
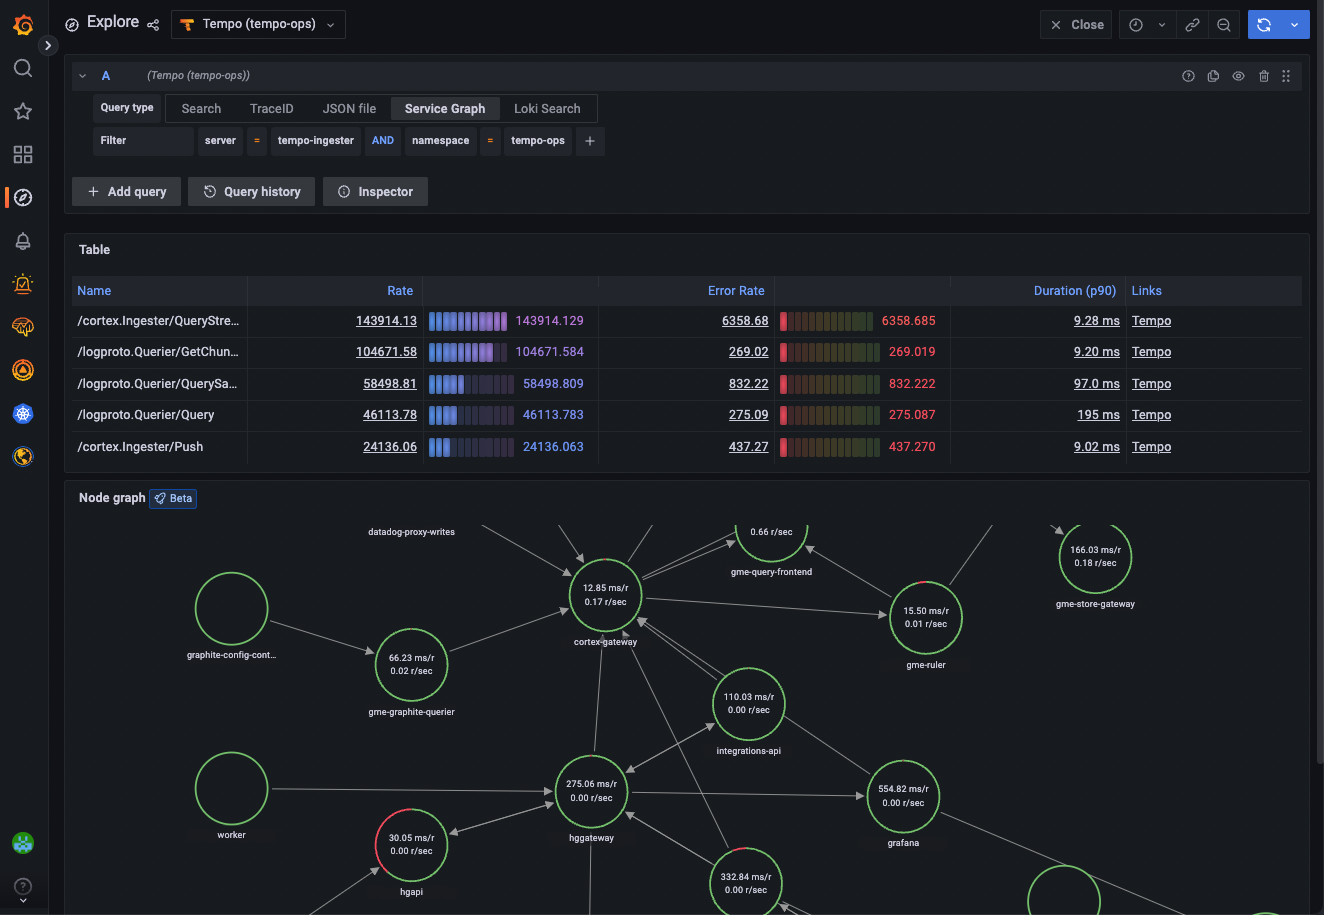
@KarstenSchnitter That is a very good way of re-phrasing my request. I think you might be right. The "serviceGraphConnector" looks like its doing the right thing. It seems to be creating desirable derived metrics form the traces, I am not sure. Tempo expects a servicegraph generated by the "Metrics Generator" , which seems to me does the same thing as the ServiceGraphConnector (?). I am not sure if Tempo will accept the servicegraph generated by OTELS "ServiceGraphConnector" as I have not tested the "ServiceGraphConnector" yet, although it seems like it should. Either way, once the properly generated metrics are sent to Tempo, it successfully generates the visualization without need for traces. It is common practice for some apps to send pre-generated servicemaps in their metrics, and often they fit the Tempo visualizer like this: (1) PS: By comparing the resulting servicegraphs from the "MetricsGenerator" with the "ServiceGraphConnector" it seems like they might doing the same thing. If so, then, how do we handle the data shaped like in point (1) ?? |
|
To my understanding, there are still some differences in the design. The service map created by Data Prepper and used by OpenSearch only contains the service graph, without metrics. The latency, throughput and error rate are calculated from the actual span data, when the visualization is created in Open Search. This is best illustrated by the OpenSearch Catalog service map. This examples contains the relevant queries mostly as PPL. The actually used queries in the observability plugin are contained in services_queries.ts in the Dashboards observability project. Again, the metrics are calculated on the fly from the spans. This approach works well, when the spans are ingested without sampling or probabilistic sampling. The approach by the OpenTelemetry Service Graph Connector provides the metrics without the spans. It will not be compatible with the OpenSearch observability plugin. However, it is possible to just ingest the metrics created by the connector and build visualizations similar to the service map on top of them. The metrics can easily be filtered by the instrumentation scope name, which is set to For Data Prepper, I see no easy way to provide data required for the service map from the OpenTelemetry Service Graph Connector. |
Is your feature request related to a problem? Please describe.
The dataprepper processor "service_maps" only works with the source "otel_traces_source".
Describe the solution you'd like
Make the "service_maps" processor work with "otel_metrics_source" as well.
Describe alternatives you've considered (Optional)
First a little about the config i worked with:
1: "gRPC oteldata" is sent to an -> otel collector.
2: then the "open telemetry collector" -> sends data to -> dataprepper.
I've tried moving the service-graph data from metrics to traces in this "otel collector", but the open telemetry collector doesn't seem to be able to do this. It can only move service-graph data "from traces to metrics", but not reverse. Its then called a "Service graph exporter", and sends the service_graph via metrics. The application in question only sends metrics and therefore its not possible to get traces (and it shouldn't be necessary to get traces). Therefore I cannot get the servicemaps as it is now into opensearch.
For those experienced with OTEL know that It is considered somewhat of a standard that the service-graph to be visualized from metrics, (this is the reason why the otelcollector lets you "transport" service_graph data to metrics exporters). Tempo for instance assumes all service-graph data to be sent via the metrics channel.
I've also tried to just manually re-construct the "force diagram" (the default one found in the observability page) using only metrics data, but it took too much time figuring out how to do it with VEGA and opensearch.
As of now, I am forced to use alternative applications to get the desired service-graphs, such as Prometheus+Tempo+grafana. However, when using this solution I cannot use the anomaly detection in opensearch, since opensearch anomaly detection on works with indexes (not with external prometheus sources) (which sucks too!). Therfore, the servicemaps must be in opensearch indexes by the way opensearch works now! The only way to fix this as I see it, is for dataprepper to handle service_maps in metrics (as is done in industry standards). In industry strandard deployments, connecting services is usually done by the "open telemetry collector" itself. Therefore it might be better if we start expecting potential service_graphs to be in the metrics channel.
Additional context
In other words: at the moment, dataprepper can only "connect" services if their "service map data" can be linked trough the traces. And only traces can be used to "connect the services"! This service-graph data cannot be "pre-configured" in the metrics object the way dataprepper works now!
So, the processor "service_maps" only works for traces. It might be desirable to make this work with metrics as well.
Letting the OtelCollector connect the services, (instead of dataprepper doing it) might increase the performance and stability for dataprepper and the overall architecture performance.
Links:
service_maps processor
otel_metrics_source
Dataprepper can't create servicemaps from metrics alone, as of now, but Its probably possible to implent this. Here is an example of how it looks like when Tempo visualizes servicemaps from metrics alone, proving its possible.:
The text was updated successfully, but these errors were encountered: