Skip to content
New issue

Have a question about this project? Sign up for a free GitHub account to open an issue and contact its maintainers and the community.

By clicking “Sign up for GitHub”, you agree to our terms of service and privacy statement. We’ll occasionally send you account related emails.

Already on GitHub? Sign in to your account

endering Performance CloudOptimizedGeotiff Band calculation ( Question rather than a feature request) #142

Open
davidoesch opened this issue Mar 21, 2024 · 2 comments

Comments

@davidoesch
Copy link

Displaying this 4 band 16int COGTIFF file size approx 4GB in leaflet via

https://cms.geo.admin.ch/Topo/umweltbeobachtung/satromocogviewer.html?url=https://data.geo.admin.ch/ch.swisstopo.swisseo_s2-sr_v100/2024-03-07t103911/ch.swisstopo.swisseo_s2-sr_v100_mosaic_2024-03-07t103911_bands-10m.tif

It is a valid COG according to gdal with 4 overviews, compressed etc

-> results in very slow performance on loading.

Firefox: After approx 10 succesfull accesses to the GOG tif file I get an "unknown duration" Staus "waiting for response" as shown here
enter image description here

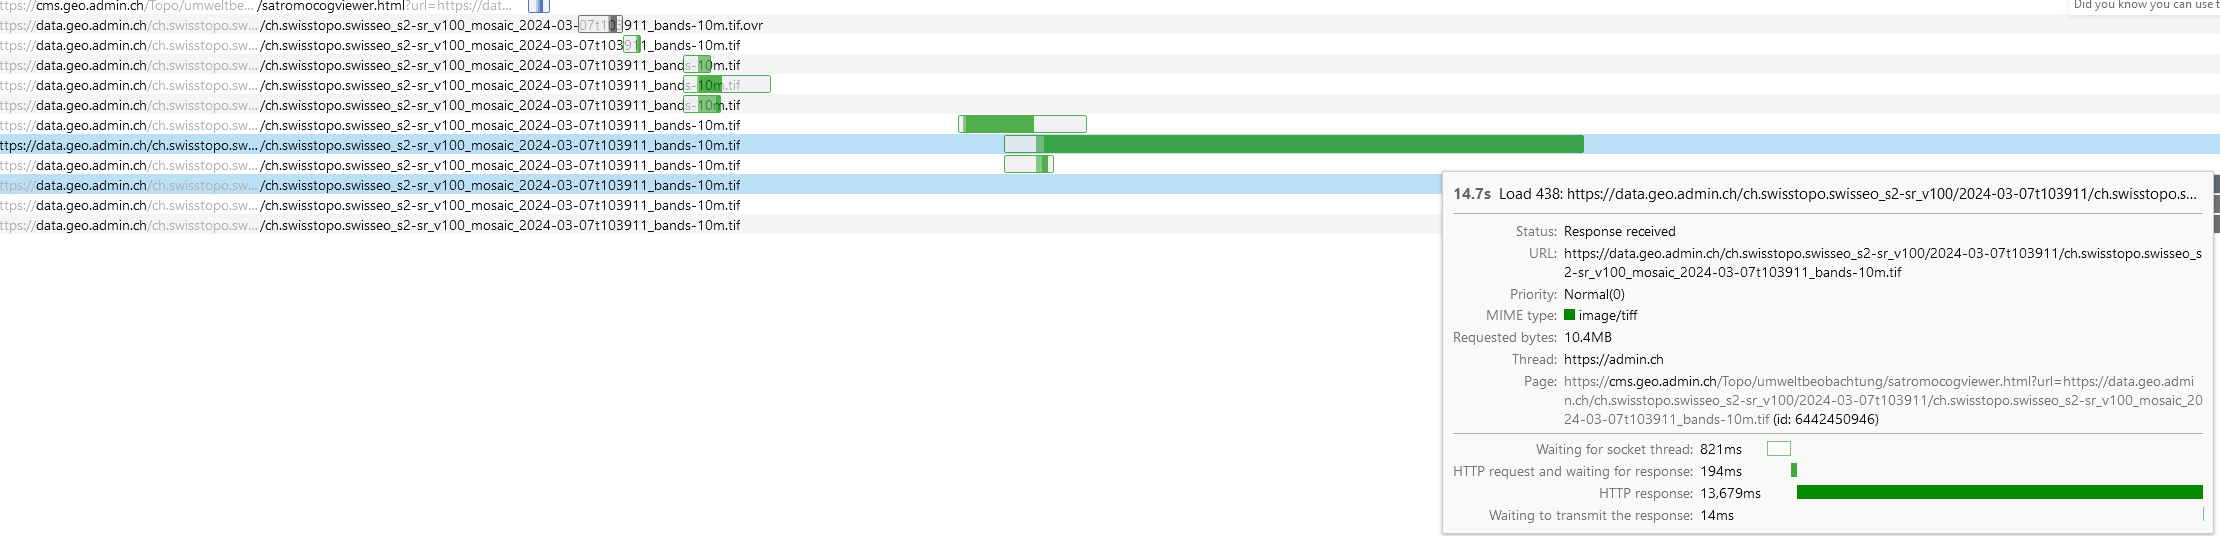
Edge: I get Violation warnings in the console but tiles are loading after while

[Violation]'requestAnimationFrame' handler took 75ms
[Violation]'setTimeout' handler took 75ms

The data is loading quite fast, an I can observe the complete download finished
enter image description here

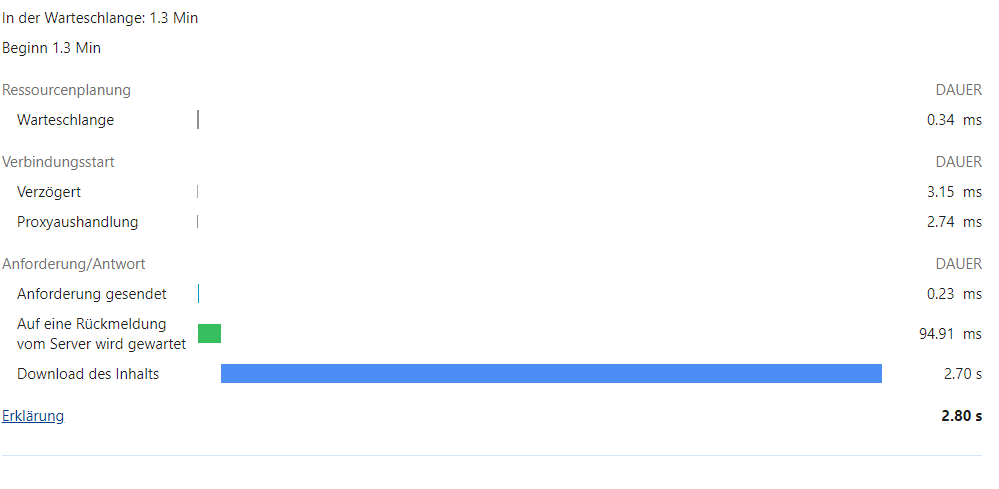
but afterwards it takes quite a while until it is rendered , I can't find any suspicous in
enter image description here

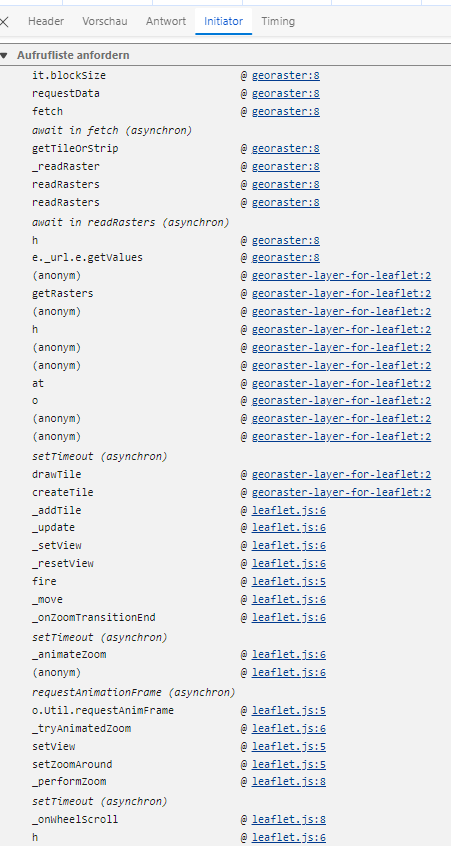
even if I use an RGB 8 bit File : RGB_COG_mosaic_2024-03-07t103911_bands-10m.tif it takes quite a while to render the image

https://cms.geo.admin.ch/Topo/umweltbeobachtung/satromocogviewer.html?url=https://cms.geo.admin.ch/test/topo/umweltbeobachtung/testcog/RGB_COG_mosaic_2024-03-07t103911_bands-10m.tif

I can't get the rendering/download accelerated : any ideas?

Here the complete code

<html>
<head>
	<title>COG viewer SATROMO</title>
	!-- Version 3.1 --> <!-- full stretch -->
    <meta name="viewport" content="width=device-width, initial-scale=1">
    <link rel="stylesheet" href="https://unpkg.com/[email protected]/dist/leaflet.css"/>
    <style>
        #map {
            bottom: 0;
            left: 0;
            position: absolute;
            right: 0;
            top: 0;
        }
    </style>
</head>
<body>
<div id="map"></div>
<script src="https://unpkg.com/[email protected]/dist/leaflet.js"></script>
<script src="https://cdnjs.cloudflare.com/ajax/libs/proj4js/2.6.0/proj4.js"></script>
<script src="https://unpkg.com/georaster"></script>
<script src="https://unpkg.com/georaster-layer-for-leaflet"></script>
<script src="https://cdnjs.cloudflare.com/ajax/libs/proj4leaflet/1.0.2/proj4leaflet.min.js"></script>
<! -- You might need this one as well
<script src="https://unpkg.com/leaflet-proj4leaflet"></script> 
--> 


<script>
    // Define custom CRS for EPSG 2056
   // Define custom CRS for EPSG 2056
	var crs2056 = new L.Proj.CRS('EPSG:2056',
	   "+proj=somerc +lat_0=46.95240555555556 +lon_0=7.439583333333333 +k_0=1 +x_0=2600000 +y_0=1200000 +ellps=bessel +towgs84=674.374,15.056,405.346,0,0,0,0 +units=m +no_defs",
	   {
		 resolutions: [4000.0, 3750.0, 3500.0, 3250.0, 3000.0, 2750.0, 2500.0, 2250.0, 2000.0, 1750.0, 1500.0, 1250.0, 1000.0, 750.0, 650.0, 500.0, 250.0, 100.0, 50.0, 20.0, 10.0, 5.0, 2.5, 2.0, 1.5, 1.0, 0.5, 0.25, 0.1, 0.05],
		 origin: [2420000.0, 1350000.0]
	 });

	var map = L.map('map', {
	  crs: crs2056
	}).setView([46, 8], 1);

    var baseLayer = L.tileLayer('https://wmts.asit-asso.ch/wmts/1.0.0/asitvd.fond_pourortho/default/default/0/2056/{z}/{y}/{x}.png', {
        maxZoom: crs2056.options.resolutions.length,
        zIndex: 5
    }).addTo(map);

// Define a variable to keep track of the layer visibility
var layerVisible = true;

// Create a button to toggle the layer
var toggleButton = L.control({position: 'topleft'});
toggleButton.onAdd = function (map) {
    var div = L.DomUtil.create('div', 'toggle-button');
    // Set the initial button text based on the layer visibility
    div.innerHTML = '<button onclick="toggleLayer()">' + (layerVisible ? 'Overlay OFF' : 'OFF') + '</button>';
    return div;
};
toggleButton.addTo(map);

// Function to toggle the layer
function toggleLayer() {
    if (layerVisible) {
        map.removeLayer(baseLayer);
    } else {
        baseLayer.addTo(map);
    }
    // Update the button text based on the layer visibility
    document.querySelector('.toggle-button button').innerText = layerVisible ? 'Overlay ON' : 'Overlay OFF';
    // Invert the layer visibility state
    layerVisible = !layerVisible;
}


    const url_to_geotiff_file = new URLSearchParams(location.search).get("url");
    console.log("url_to_geotiff_file:", url_to_geotiff_file);

    if (!url_to_geotiff_file || !url_to_geotiff_file.endsWith(".tif")) {
        // If no URL is provided, or if it doesn't end with ".tif", display a message for non-supported imagery
        document.getElementById("map").innerHTML = "<h3>Non-supported imagery</h3>";
    } else if (url_to_geotiff_file.includes("ch.swisstopo.swisseo_vhi")) {
        console.log("This is VHI");
				
        // Parse the GeoTIFF data
        parseGeoraster(url_to_geotiff_file).then(function (georaster) {
            console.log("georaster:", georaster);
			// based on https://custom-scripts.sentinel-hub.com/custom-scripts/sentinel-2/l2a_optimized/ 	
		
        // Execute code for ch.swisstopo.swisseo_vhi
        // For example:https://cms.geo.admin.ch/test/topo/umweltbeobachtung/testcog/ch.swisstopo.swisseo_vhi_v100_mosaic_2023-10-16T235959_bands-10m.tif
        // yourVHICodeHere();
		// Define color map
    // Define the function to map pixel values to colors
    const pixelValuesToColorFn = value => {
        // Define your logic here to map pixel values to colors
        // For example, you can use a color scale or custom logic based on specific thresholds
	const scale = chroma.scale([
			'#C7BB95',
			'#FEFEE1',
			'#6E9F62',
			'#032816',
			'black'
		  ]).domain([
			0,
			10,
			40,
			60,
			80
		  ]);
        // Here's a simple example using a color scale:
        const color = scale(value).hex(); // Assuming 'scale' is defined elsewhere
		console.log("color:", color);
        return color;
    };

		// Modify the pixelValuesToColorFn function
		const layer = new GeoRasterLayer({
			attribution: "Contains modified Copernicus Sentinel data 2024, (c) Openstreetmap contributors provided by ASIT",
			debugLevel: 0,
			georaster,
			resolution: 256,
			opacity: 1,
			resampleMethod: "nearest",
			pixelValuesToColorFn 
		});

            layer.addTo(map);
            map.fitBounds(layer.getBounds());
		 });
	
    } else if (url_to_geotiff_file.includes("ch.swisstopo.swisseo_s2-sr")) {
        console.log("This is S2 SR");


        // Parse the GeoTIFF data
        parseGeoraster(url_to_geotiff_file).then(function (georaster) {
            console.log("georaster:", georaster);
			// based on https://custom-scripts.sentinel-hub.com/custom-scripts/sentinel-2/l2a_optimized/ 	
		
		// Contrast enhance / highlight compress
		const maxR = 3.0; // max reflectance
		const midR = 0.13;
		const sat = 1.2;
		const gamma = 1.8;
		
		
		function evaluatePixel(val0,val1,val2) {
			//console.log("val0:", val0, "val1:", val1, "val2:", val2);
			const rgbLin = satEnh(sAdj(val0), sAdj(val1), sAdj(val2));
			//console.log("rgbLin:", rgbLin);
			//console.log("sRGB0:", sRGB(rgbLin[0]), "sRGB1:", sRGB(rgbLin[1]), "sRGB2:", sRGB(rgbLin[2]));
			return [sRGB(rgbLin[0]), sRGB(rgbLin[1]), sRGB(rgbLin[2])];
		}
		
		function sAdj(a) {
			return adjGamma(adj(a, midR, 1, maxR));
		}

		
		const gOff = 0.01;
		const gOffPow = Math.pow(gOff, gamma);
		const gOffRange = Math.pow(1 + gOff, gamma) - gOffPow;


		function adjGamma(b) {
			return (Math.pow((b + gOff), gamma) - gOffPow) / gOffRange;
		}
		
		// Saturation enhancement
		function satEnh(r, g, b) {
			const avgS = (r + g + b) / 3.0 * (1 - sat);
			return [clip(avgS + r * sat), clip(avgS + g * sat), clip(avgS + b * sat)];
		}

		function clip(s) {
			return s < 0 ? 0 : s > 1 ? 1 : s;
		}

		//contrast enhancement with highlight compression
		function adj(a, tx, ty, maxC) {
			var ar = clip(a / maxC, 0, 1);
			return ar * (ar * (tx / maxC + ty - 1) - ty) / (ar * (2 * tx / maxC - 1) - tx / maxC);
		}

		const sRGB = (c) => c <= 0.0031308 ? (12.92 * c) : (1.055 * Math.pow(c, 0.41666666666) - 0.055);


            const layer = new GeoRasterLayer({
                attribution: "Contains modified Copernicus Sentinel data 2024, (c) Openstreetmap contributors provided by ASIT",
                debugLevel: 0,
                georaster,
                resolution: 256,
				opacity:1,
                resampleMethod: "nearest",
                pixelValuesToColorFn: values => {
                    // Check if any of the bands have a value of 9999 or 0
                    if (values.some(value => value === 9999 )) {
					//if (values.some(value => value === 9999 || value === 0)) {
                        // If any band has a value of 9999 or 0, return transparent color
                        return 'rgba(0, 0, 0, 0)'; // Transparent color
                    } else {
                        // Apply min-max normalization to each band
						const r = Math.round(evaluatePixel(values[0]/10000, values[1]/10000, values[2]/10000)[0] * 255);
						const g = Math.round(evaluatePixel(values[0]/10000, values[1]/10000, values[2]/10000)[1] * 255);
						const b = Math.round(evaluatePixel(values[0]/10000, values[1]/10000, values[2]/10000)[2] * 255);


                        // Return RGB color
                        return `rgba(${r},${g},${b},1)`;
                    }
                }
            });

            layer.addTo(map);
            map.fitBounds(layer.getBounds());
        });
    } else {
	console.log("This is RGB data");
	 // Parse the GeoTIFF data
        parseGeoraster(url_to_geotiff_file).then(function (georaster) {
            console.log("georaster:", georaster);
			const layer = new GeoRasterLayer({
				attribution: "Contains user data, (c) Openstreetmap contributors provided by ASIT",
				debugLevel: 0,
				georaster,
				resolution: 256,
				opacity: 1,
				
			});
			layer.addTo(map);
            map.fitBounds(layer.getBounds());
	    });
	};
	
    // Prompt user for GeoTIFF URL if none is provided
    if (!url_to_geotiff_file) {
        const defaultGeoTIFFURL = "https://data.geo.admin.ch/ch.swisstopo.swisseo_s2-sr_v100/2024-02-23t103031/ch.swisstopo.swisseo_s2-sr_v100_mosaic_2024-02-23t103031_bands-10m.tif";
        const userGeoTIFFURL = prompt("Please enter the URL for the RGB GeoTIFF file (EPSG:2056):", defaultGeoTIFFURL);
        if (userGeoTIFFURL) {
            const parser = new URL(window.location);
            parser.searchParams.set("url", userGeoTIFFURL);
            window.location = parser.href;
        } else {
            document.getElementById("map").innerHTML = "<h3>No GeoTIFF URL provided</h3>";
        }
}

</script>
</body>

@jfoclpf
Copy link

jfoclpf commented Apr 9, 2024

How do you expect the front-end will render 4GB of raster data? The data needs to be downloaded and processed by the browser.

You should divide that in small GeoTIFF tiles or reduce resolution

@davidoesch
Copy link
Author

Nope the data needs not to be downloaded as a whole : only partial ( 204) since it is cogtif and cloudnative

Sign up for free to join this conversation on GitHub. Already have an account? Sign in to comment
Labels
None yet
Projects
None yet
Development

No branches or pull requests

2 participants